


 161 / 352

157
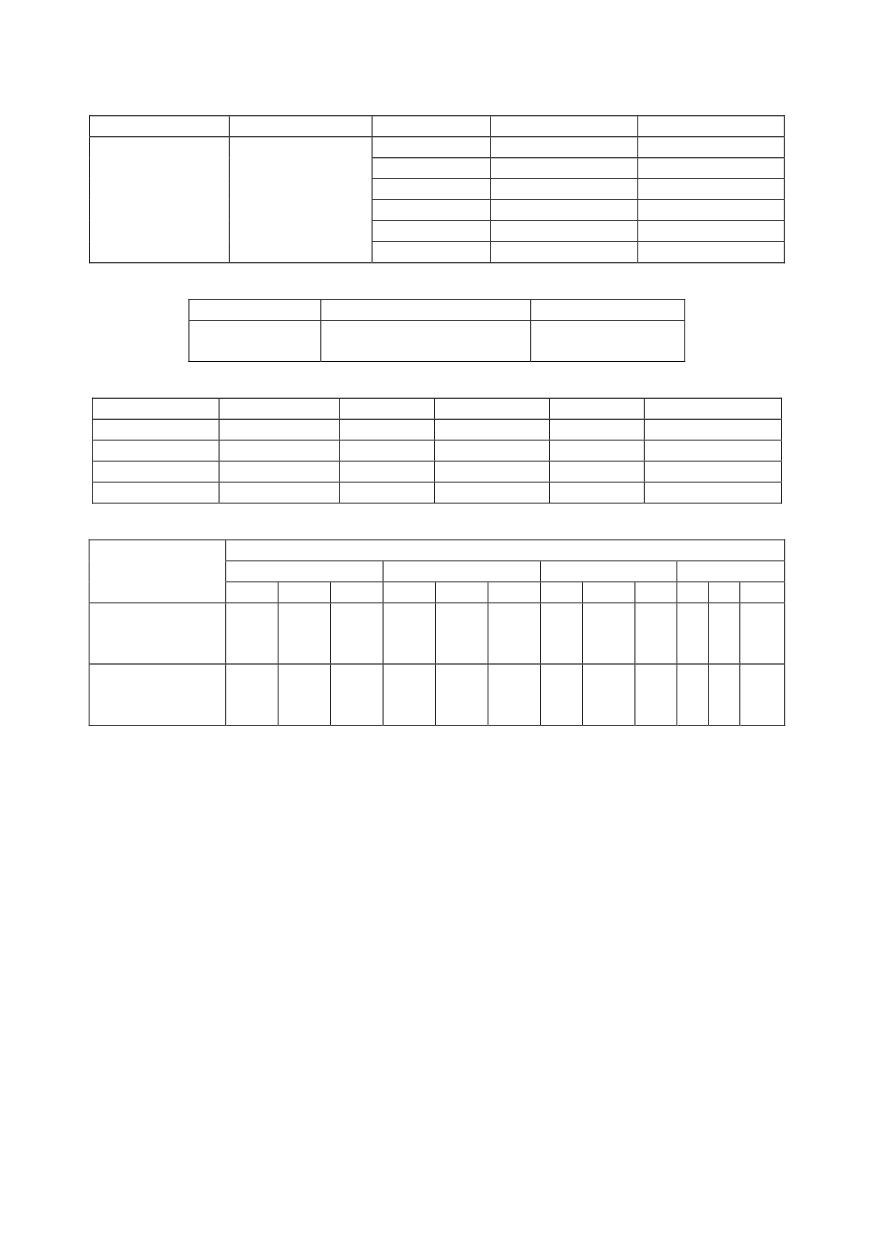
Table 8: Welding parameters for manual arc welding (MAW) of NN 70 steel
Base metal
Electrode
Pass
Diameter, mm
Heat input,
Q
, J/cm
1
3.25
16.9
2
3.25
15.1
3
4
19.4
4
4
20.4
5
4
18.9
NN70
EVB 75
6
4
19.0
Table 9: Tensile properties of the welded joint specimens.
Electrode
Tensile strength,
R
m
, MPa
Contraction,
Z
, %
EVB 75
766
759
68.8
67.7
Table 10: Results of guided bend test of welded joints
Specimen
Thickness, mm Filler metal Bending angle Bending on Fracture position.
7B2
18
EVB 75
30°
Face
Fusion line
7B20
18
EVB 75
180°
Root
Fusion line
7B3
18
EVB 75
30°
Face
Weld metal
7B30
18
EVB 75
180°
Root
No fracture
Table 11: Charpy energy (V-notch) of welded joint constituents
Charpy energy, J, at
20°C
- 60°C
- 100 °C
- 140°C
Notch
position
t
ini
pr
t
ini
pr
t
ini
pr
t ini pr
Weld metal
47
40
43
17
12
19
30
28
24
23
16
16
14
6
7
9
10
9
7
10
7
4
6
4
3
4
3
5
8
6
2
5
2
3
3
4
Heat-affected-
zone
64
123
64
35
80
47
29
43
17
53
91
72
43
51
50
10
40
22
99
48
58
89
27
37
10
21
21
t – total energy; ini – energy for crack initiation; pr – energy for crack propagation
6.2. The effect of microstructural heterogeneity on notch and crack resistance
The testing results obtained with V-notched and pre-cracked specimens depend on the
position of the notch root and the crack tip in the microstructure (Fig. 8). Although
different, the microstructures of the BM and WM are homogeneous and the scatter of the
obtained test results was not significant. However, the scatter of the results obtained for
the HAZ (Table 11) was significant due to microstructural heterogeneity and required
detailed analysis. The transition region at the fusion line, presented in Fig. 13, is positi-
oned between the cast microstructure of the WM, left, and the coarse-grained (CG) HAZ
region, right. On the other boundary of the HAZ (Fig. 14), there is a transition region
between the directed fine grains (FG) of the rolled BM, left, and the fine grains of the
tempered HAZ, right. Although the microstructure of the WM (Fig. 9) is a cast one, it
presents a continuous homogeneous metal of sufficient volume, enabling the determina-
tion of the WM properties, including notch and crack resistance. This is not the case with
the HAZ. Exposed to successive heat inputs, the microstructure of the HAZ in the regions
between two boundaries, given in Figs. 13 and 14, changed during welding. The details of
this microstructure are presented in Fig. 15 along the crack tip in a pre-cracked specimen.