


 95 / 352

91
number of cycles can be applied for the intercept on the stress-amplitude axis. Examples
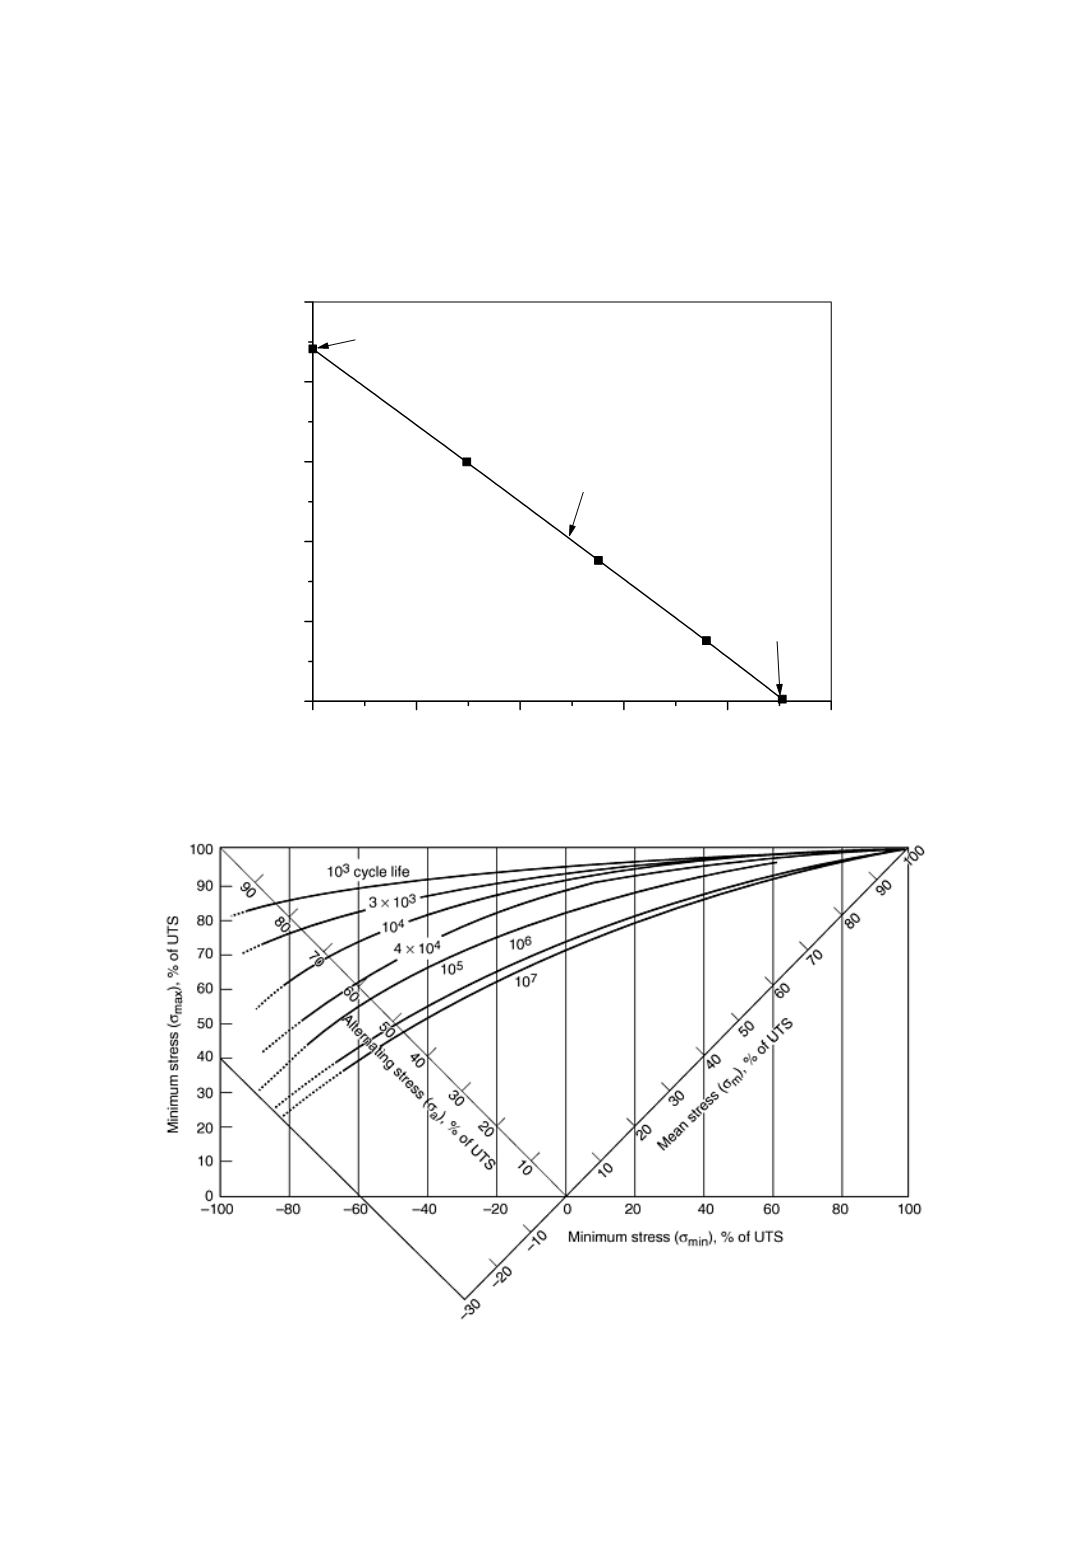
of the Haigh and constant-life diagrams are shown in Fig. 3 and 4. Figure 4 is of interest
also because of its design in terms of ultimate tensile strength percentage for the strength
ranges included. This diagram is for average test data for axial loading of polished
specimens of AISI 4340 (DIN 40 NiCrMo6) steel (ultimate tensile strength, UTS, 850 to
1250 MPa) and is applicable to other steels (e.g., AISI 2330,4130, 8630) /11/.
0
200
400
600
800
1000
0
100
200
300
400
500
Alloy steel 900 MPa
ultimate tensile strength
Goodman line represents
uncorrected 10
6
estimate
at 50% failure
Goodman
line
Ultimate
strength
Fatigue limit or
fatigue strength
Stress amplitude, MPa
Mean stress, MPa
Figure 3: Haigh diagram based on employed approximations for the axes intercepts and using the
Goodman line to establish the acceptable envelope for safe-life, infinite-life combinations
Figure 4: A constant-life diagram for alloy steels that provides combined axes for more ready
interpretation. Note the presence of safe-life, finite-life lines on this spot.