


 94 / 352

90
presentation displays mean stress effects in the safe-life, infinite-life regime, proposed by
Haigh. The Haigh diagram is a plot of real data, but it requires an enormous amount of
information. More convenient means to show the same information incorporates the
Haigh diagram with
S
max
and
S
min
axes to produce a constant-life diagram (Fig. 3).
10
3
10
4
10
5
10
6
10
7
10
8
0
100
200
300
400
500
600
700
800
Steel
Nonferrous
Stress amplitude,
Δ
S/2, MPa
Number of cycles failure
Figure 1: Schematic
S
-
N
representation of materials having asymptotic fatigue limit behaviour
(up) and those displaying a fatigue strength response - continuously decreasing property (down)
10
4
10
5
10
6
10
7
0
100
200
300
400
500
600
700
800
a
)
R = -1
R = 0
R = 0.6
Stress amplitude,
Δ
S/2, MPa
Number of cycles to failure
10
4
10
5
10
6
10
7
0
40
80
120
160
200
b
)
R = 0.6
R = 0
R = -1
Maximum stress, MPa
Number of cycles to failure
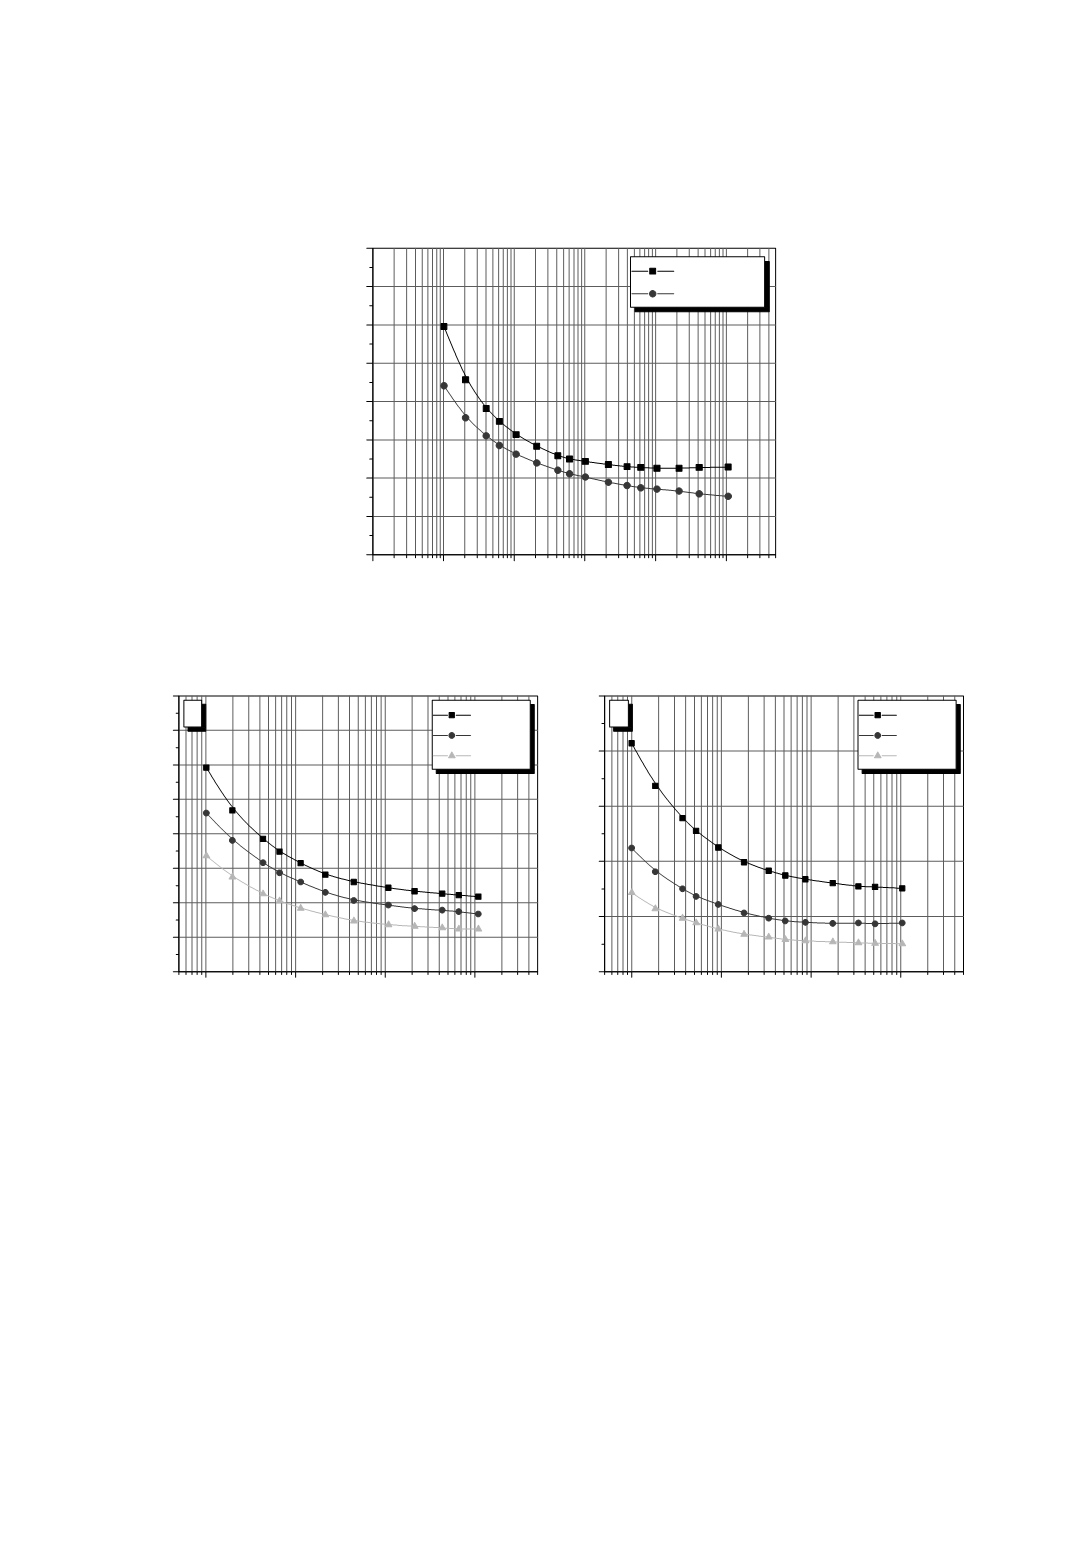
Figure 2: The influence of method of
S
-
N
data presentation on the effect of
R
(=
S
min
/
S
max
) value.
Stress amplitude
S
a
vs. number of cycles
N
(left), maximum stress
S
max
vs. N (right) /10/
For general consideration of mean stress effects, various models of the mean-ampli-
tude response have been proposed. A commonly used presentation is the Goodman line,
although other models are possible (e.g., Gerber and Soderberg). The conventional plot
associated with this problem is produced using the Haigh diagram, with the Goodman
line connecting the ultimate strength on
S
max
, and the fatigue limit, corrected fatigue limit,
or fatigue strength, on
S
a
. This line then defines the boundary of combined mean-
amplitude pairs for anticipated safe-life response. The Goodman relation is linear and can
be readily adapted to a variety of manipulations.
In many cases Haigh or constant-life diagrams are simply designed, using the
Goodman presentation approximating actual response through the model of the beha-
viour. For materials that do not have a fatigue limit, the fatigue strength at a given