


 154 / 352

150
where
C
is a constant, depending on specimen and crack geometry,
σ
,
MPa, is nominal
stress, and
a
, mm,
is crack size. One of the basic principles of fracture mechanics is that
unstable fracture occurs when the stress-intensity factor reaches a critical value, Table 1.
For mode I loading (opening, tensile mode) and for negligible crack-tip plastic defor-
mation (plane-strain conditions), the critical stress-intensity factor for fracture instability,
K
Ic
, represents the inherent ability of a material to resist tensile crack extension. However,
this fracture-toughness property varies with constraint, and like other material properties
such as yield strength, varies with temperature and loading rate as follows.
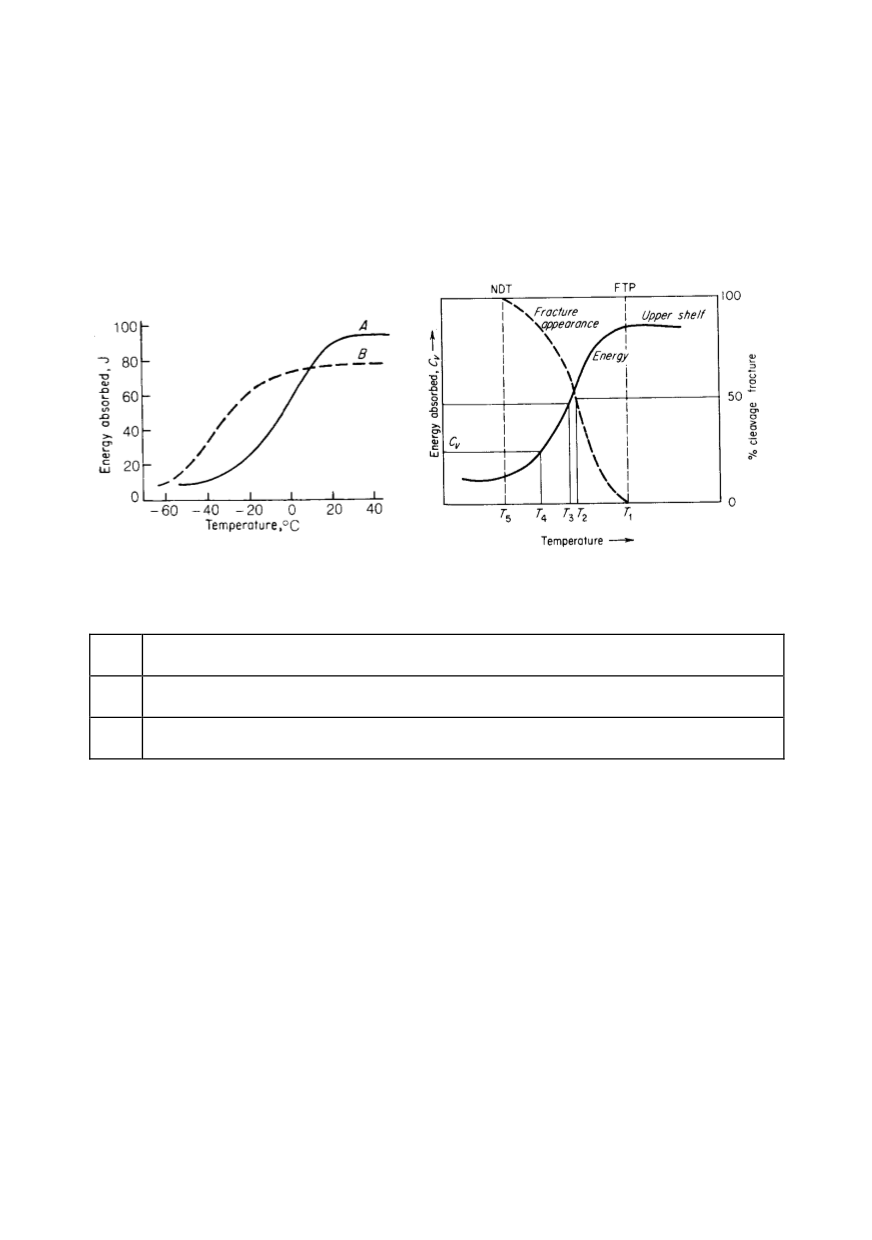
Figure 5: Transition-temperature curves for two steels, showing fallacy of depending on room-
temperature results (left), various criteria of transition temperature obtained in Charpy test (right)
Table 1: Stress-intensity factors
K
c
Critical stress-intensity factor for static loading and plane-stress conditions of variable
constraint. This value depends on specimen thickness and geometry, and on crack size.
K
Ic
Critical stress-intensity factor for static loading and plane-strain conditions of maximum
constraint. This value, a minimum value for thick plates, is material property.
K
Id
Critical stress-intensity factor for dynamic (impact) loading and plane-strain conditions of
maximum constraint.
Each value from Table 1 (
K
c
,
K
Ic
,
K
Id
), is also a function of temperature, particularly
for structural materials exhibiting a transition from ductile to brittle behaviour /9,10, 11/.
Knowing the critical value of
K
at failure (Table 1) for a given material of a particular
thickness and at a specific temperature and loading rate, the designer can determine flaw
sizes that can be tolerated in structural members for a given design stress level. Conver-
sely, the designer can determine the design stress level that can be safely used for an exis-
ting crack, present in a structure. In general, the relationship among fracture toughness
(
K
), stress (
σ
), and crack size (
a
) is shown schematically in Fig. 6 for through thickness
crack in a plate. The figure shows that there are for particular material many combina-
tions of stress and crack size (
σ
f
,
a
f
) that may cause fracture, and many of them (
σ
0
, a
0
)
when fracture will not take place, under slow loading and at given test temperature.
High-toughness structural materials undergo extensive plastic deformation prior to
fracture, and for them EPFM parameters are applicable. Crack-tip opening displacement
(CTOD), corresponding to slow loading rates is also applicable in LEFM, and the J-
integral, as an energy criterion for slow loading rates, is used in EPFM .
Based on either of them, crack resistance curve (R-curve) is defined, indicating frac-
ture resistance of material to stable crack growth.