


 126 / 352

122
Y
ref
r
L
σ
σ
⋅
=
(18)
The corresponding reference strain
ε
ref
is obtained from the true stress-strain curve. No
distinction is necessary between materials with and without a Lüders plateau. On the
other hand
σ
ref
/
ε
ref
values have to be available at
L
r
= 0.7; 0.9; 0.8; 1; 1.02; 1.1 and other
values of
L
r
.
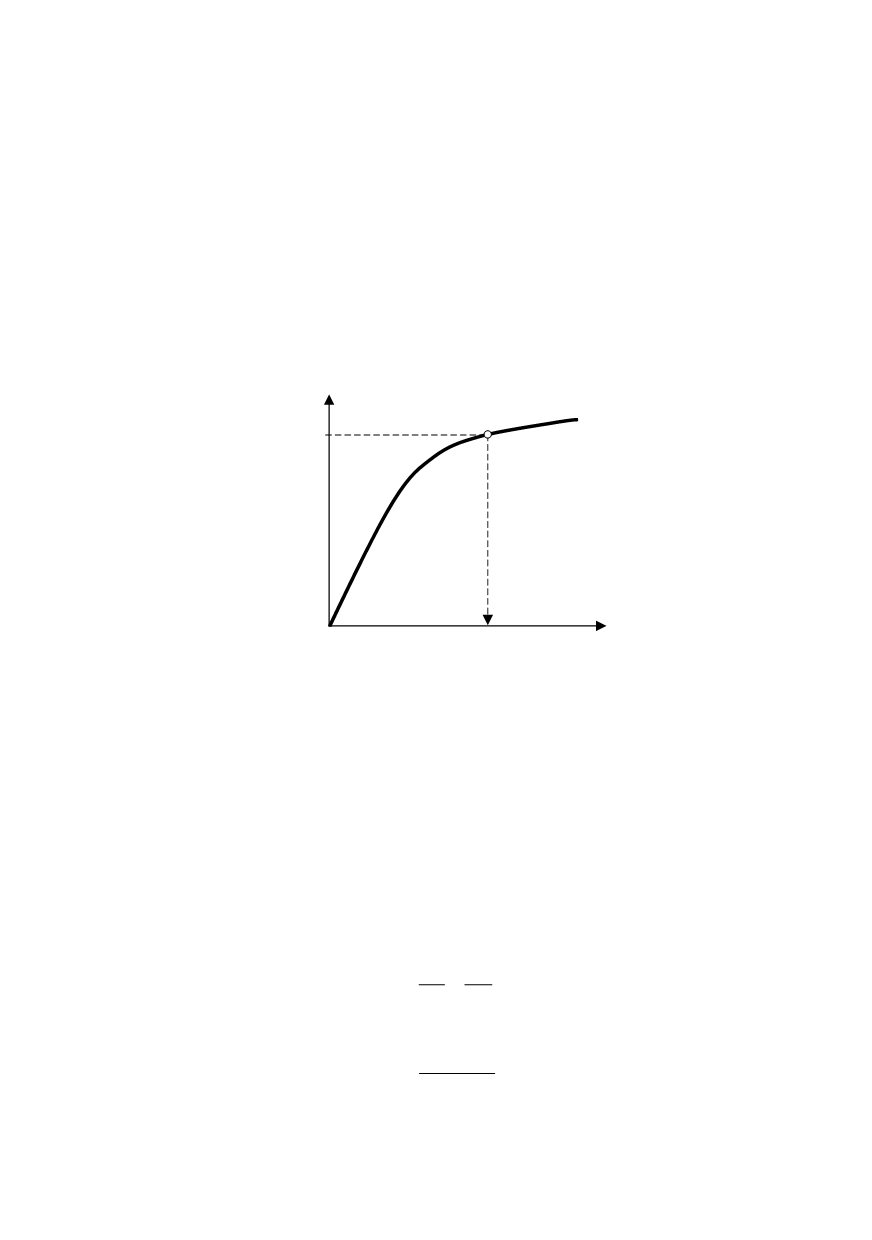
6.7. The true stress-strain curve of the material
The reference strain,
ε
true
, for the assessment of the normalized load, can be determi-
ned from the true stress-strain curve. With engineering stress,
σ
, and strain,
ε
, (Fig. 18),
true stress and strain values,
σ
t
and
ε
t
, are defined by:
(
)
(
)
t
t
1
1
ln
ε
ε
σ
σ
ε
= +
= +
(19)
Figure 18: True stress – true strain curve
6.8. Comparison of crack driving force (CDF) and fracture analysis diagram (FAD)
Applying the fracture analysis diagram (FAD) philosophy a failure line is designed by
normalizing the crack tip loading with the material's fracture resistance (Fig. 19). The
assessment of the component is then based on the relative location of a geometry depen-
dent assessment point with respect to this failure line. In the simplest application the com-
ponent is regarded as safe as long as the assessment point lies within the area enclosed by
the failure line. It is potentially unsafe if it is located on or above the failure line. Basic
relations are presented by Eqs. (20) to (24).
Failure assessment curve:
( )
r
r
K f L
=
(20)
Y Y
r
F L
F
σ
σ
= =
(21)
Loading path:
(
)
I
mat
r
K a, F
K
K
=
(22)
σ
ref
=
L
r
⋅
σ
Y
true strain
ε
ref
=
ε
true
=ln(1+
e
)
ε
ref
true stress
σ
ref
=
σ
true
=
R
(1+
e
)