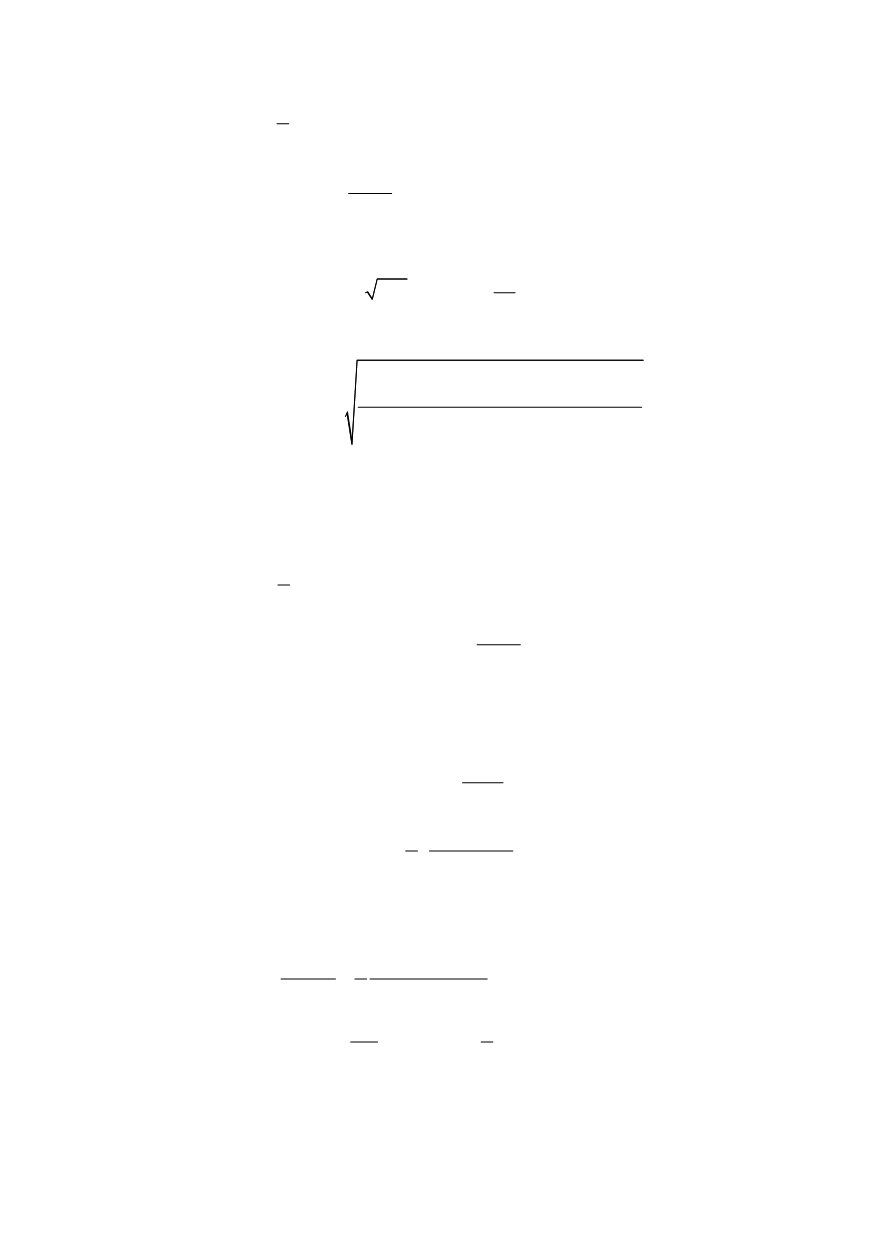

121
(
)
1 2
2
6
1 1
x 0 3 0 7
0 6 for 0
2
/
max
r
r
r
r
r
f ( L )
L
,
, exp , L
L L
−
⎡
⎤
⎡
⎤
= +
+
−
≤ ≤
⎢
⎥
⎣
⎦
⎣
⎦
(7)
2 5
0 2
150
1
,
max
r
p .
L
R
⎡
⎤
= + ⎢
⎥
⎢
⎥
⎣
⎦
,
0 2
where
is in MPa
p .
R
(8)
The fracture toughness is estimated in a conservative way from Charpy data by:
(
)
1/4
mat
25
12
20
20
B
K
KV
⎡
⎤
⎛ ⎞
=
− ×
+
⎢
⎥
⎜ ⎟
⎝ ⎠
⎢
⎥
⎣
⎦
(9)
on the lower shelf and by:
(
)
(
)
(
)
0 256
0 2
0,133
1 28
mat
2
0 53
0,2
1000 1
,
,
KV
,
J
E ,
KV
K K
ν
⋅
⋅
⋅
×
= =
⋅ −
(10)
on the upper shelf (
K
mat
, MPa√m; specimen thickness
B
, mm; Charpy energy
KV
, J).
In addition, SINTAP offers a correlation for the ductile-to-brittle transition based on
the Charpy transition temperature for 28 J.
Basic level
(
)
1 2
2
6
1 1
0 3 0 7
0 6 for 0
1
2
/
r
r
r
r
f ( L )
L
,
, exp
, L
L
μ
−
⎡
⎤
⎡
⎤
= +
× +
− ⋅
≤ ≤
⎢
⎥
⎣
⎦
⎣
⎦
(11)
with
0 2
0 001
0 6
p ,
E ,
R
min
,
μ
⎡
⋅
⎢ = ⎢
⎢⎣
(12)
(
)
(
)
1 2
1
for 1
N / N
max
r
r
r
r
r
f ( L ) f L
L
L L
−
= = ×
≤ ≤
(13)
p0,2
m
0 3 1
R
N ,
R
⎡
⎤
= ⋅ −⎢
⎥
⎣
⎦
(14)
p0,2 m
p0,2
1
2
max
r
R R
L
R
⎡
⎤ +
= ⎢
⎥
⎢
⎥
⎣
⎦
(15)
with
L
r
max
being the limit against plastic collapse.
Advanced level
(
)
1 2
2
ref
ref
ref
ref
1
for 0
2
/
max
r
r
r
r
E
L
f ( L )
L L
E /
ε
σ
ε
σ
−
⎡
⎤
⋅
=
+
≤ ≤
⎢
⎥
⋅
⎢
⎥
⎣
⎦
(16)
where
(
)
f
f
Y m
Y
1
with
2
max
r
L
R
σ
σ
σ
σ
=
=
+
(17)
Different to the Levels above,
f
(
L
r
) is a continuous function, which follows point-wise
the true stress-strain curve. Each value of
σ
ref
is assigned to an
L
r
value by


