


 82 / 352

78
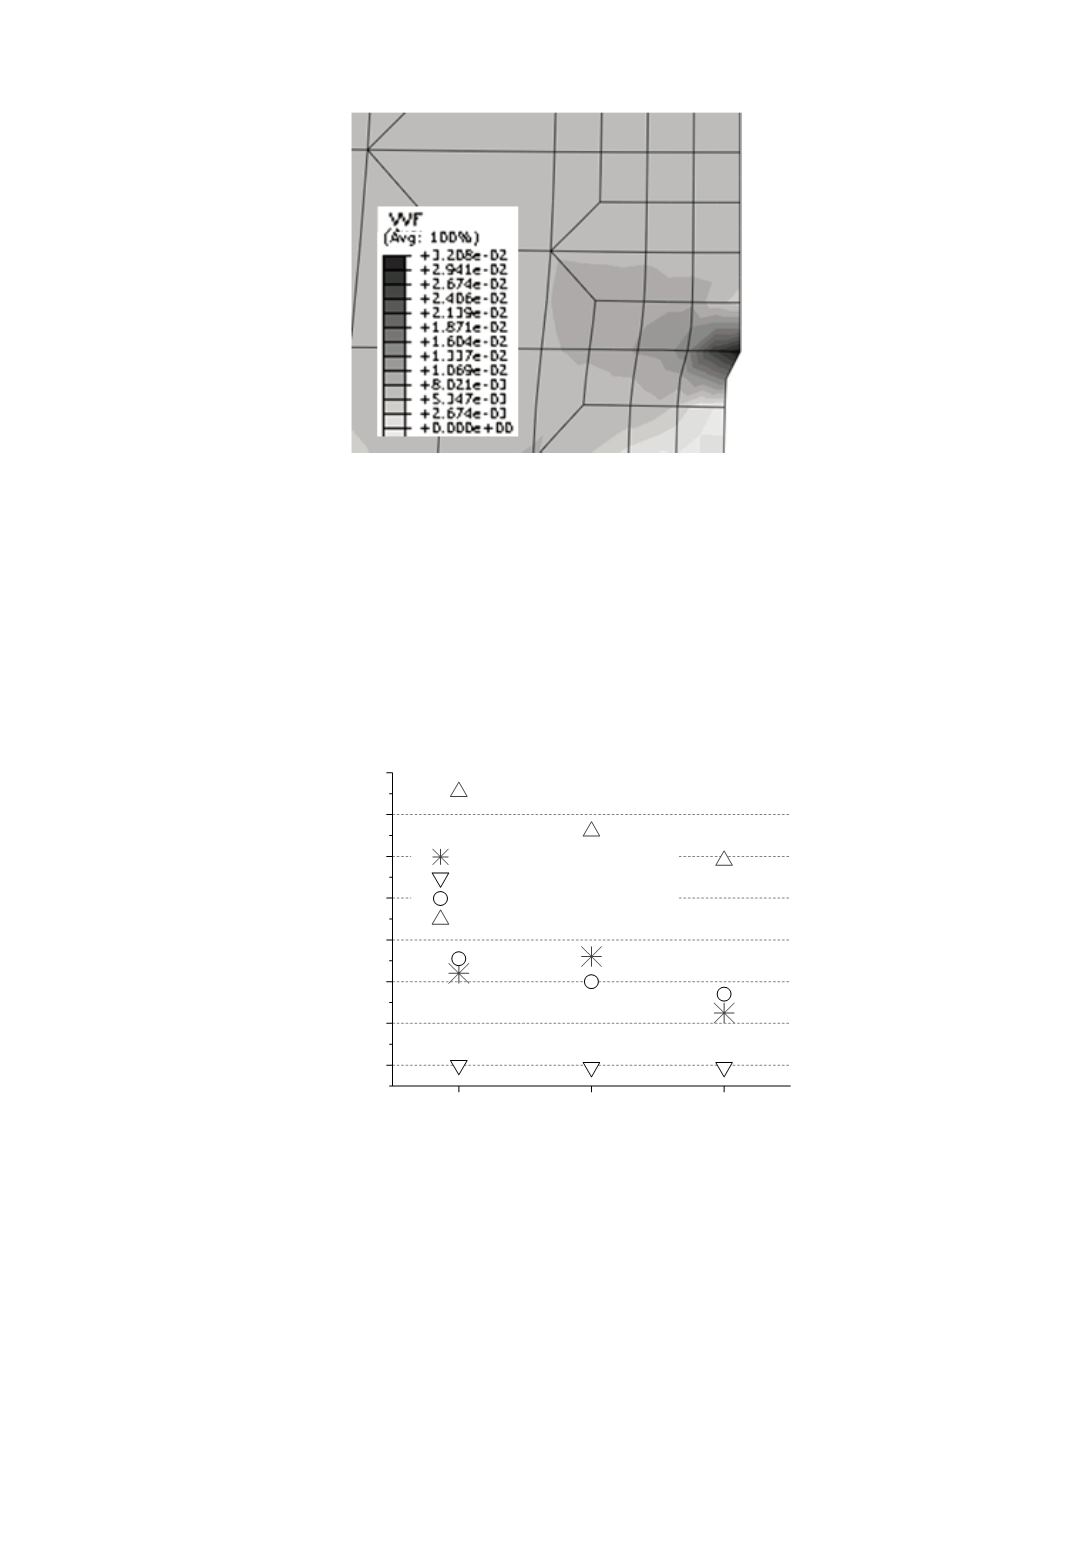
Figure 7: Distribution of void volume fraction
f
near the crack tip at the crack growth initiation
The influence of the finite element size, formulation and integration order on the
results of the crack growth initiation analysis on SENB specimen is considered in this
section. In addition to the adopted FE size 0.15x0.15 mm (corresponding to the mean free
path between the inclusions in WM, according to /15, 25/), two other FE sizes are
considered: 0.3x0.3 mm and 0.075x0.075 mm. The results obtained in /39/ using these
sizes of 8-noded elements with reduced (2x2) integration are given in Fig. 8. CTOD value
at the crack growth initiation (CTOD
i
) is determined when damage parameter
f
reaches
critical value
f
c
at the integration point nearest to the crack tip, see /15, 40/. Nucleation of
the secondary voids is not taken into account here, but will be analysed later on.
0.04
0.06
0.08
0.10
0.12
0.14
0.16
0.18
Exp.
CGM, FE 0.075x0.075 mm
CGM, FE 0.15x0.15 mm
CGM, FE 0.3x0.3 mm
2
H
[mm]
CTOD
i
[mm]
18
12
6
Figure 8: The influence of element size on the CTOD
i
values, 8-noded FE with reduced integration
Calculation with FE size 0.3x0.3 mm gives higher material resistance than the real
one, while the opposite is obtained with FE size 0.075x0.075 mm. It is clear that FE size
similar to the mean free path between the inclusions is the most suitable in this case.
Besides the FE size ahead the crack tip, formulation of the element and the integration
order should also be taken into account. The results obtained using various elements with
dimensions 0.15x0.15 mm (Fig. 9) imply that the integration order has a strong influence
on predicted CTOD
i
values. The use of 8-noded elements with full integration leads to
much smaller values, which are very close to those obtained with 8-noded elements with