


 79 / 352

75
critical value of damage parameter in the element ahead the crack tip. Similar procedure
can be applied for the coupled models, using the critical value of appropriate damage
parameter. This group of models offers another possibility - advance of the crack can be
regarded as loss of material load-carrying capacity in the ligament ahead the crack tip. As
the criterion for ductile fracture initiation is satisfied, the element ahead the current crack
tip fails, according to the equations of the used micromechanical model. This approach is
used in given example, and the criterion for the crack growth is determined by the CGM.
Unlike the coupled micromechanical models, where the influence of the voids is
defined through void volume fraction (porosity), there are techniques that include
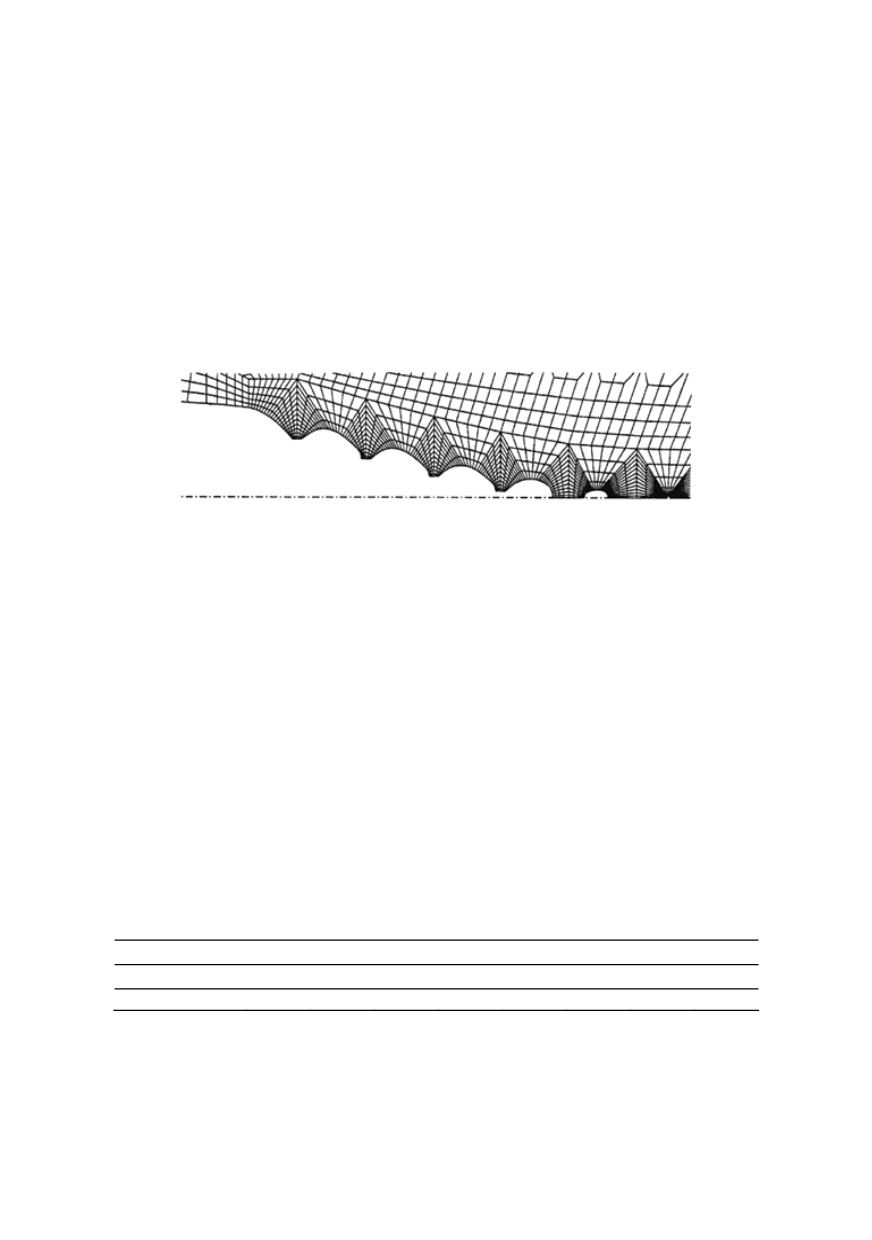
modelling of each void, using a very refined mesh around them. This approach is used by
Tvergaard and Hutchinson /30/ and Tvergaard /31/, and the mesh in the part of the
ligament in front of the crack tip is shown in Fig. 2.
Figure 2: Modelling of the voids in front of the crack tip /31/
Crack growth is modelled by node release technique; nodes are released at critical
value of the ligament thickness, see /30 – 32/. This way of crack growth modelling is very
time-consuming and requires significant computational resources. However, only a small
number of voids can be analysed, which is why it cannot be used for real components and
specimens. On the other hand, this method is very useful for detailed analysis of the void
size and distribution effects on the fracture process and material behaviour.
5. PREDICTION OF DUCTILE FRACTURE IN WELDED JOINT
5.1. Material properties
An example of application of the CGM is presented through the analysis of the crack
initiation and stable growth in NIOMOL 490 high-strength low-alloyed (HSLA) steel
welded joints. For details about the welding process and experimental procedure see /33/.
Chemical composition of the base metal (BM) and weld metal (WM) are given in
Table 2. Tensile properties and true stress - true strain curves of BM and WM, determined
on round tensile specimens, are given in Figure 3. Overmatched welded joint of the
mismatch ratio
M = R
p
0.2
(WM)
/R
p
0.2
(BM)
≈ 1.19 had been prepared.
Table 2: Chemical composition of the base metal and weld metal
Material
C
Si
Mn
P
S
Cr
Mo
Ni
Base metal (BM) 0.123
0.33
0.56
0.003 0.002
0.57
0.34
0.13
Weld metal (WM) 0.04
0.16
0.95
0.011 0.021
0.49
0.42
2.06
The presence of sulphides, oxides, silicates and complex inclusions in tested materials
is determined by microstructural analysis. Both BM and WM contain a significant
fraction of oxides. Microphotograph with several such clusters in BM is shown in Fig. 4.
The volume fraction of non-metallic inclusions
f
v
is determined as the mean value for
all measurement fields, taken successively on surfaces of prepared samples (ASTM