


 86 / 352

82
0.0 0.1 0.2 0.3 0.4 0.5 0.6 0.7 0.8
0
10
20
30
40
50
60
70
80
90
100
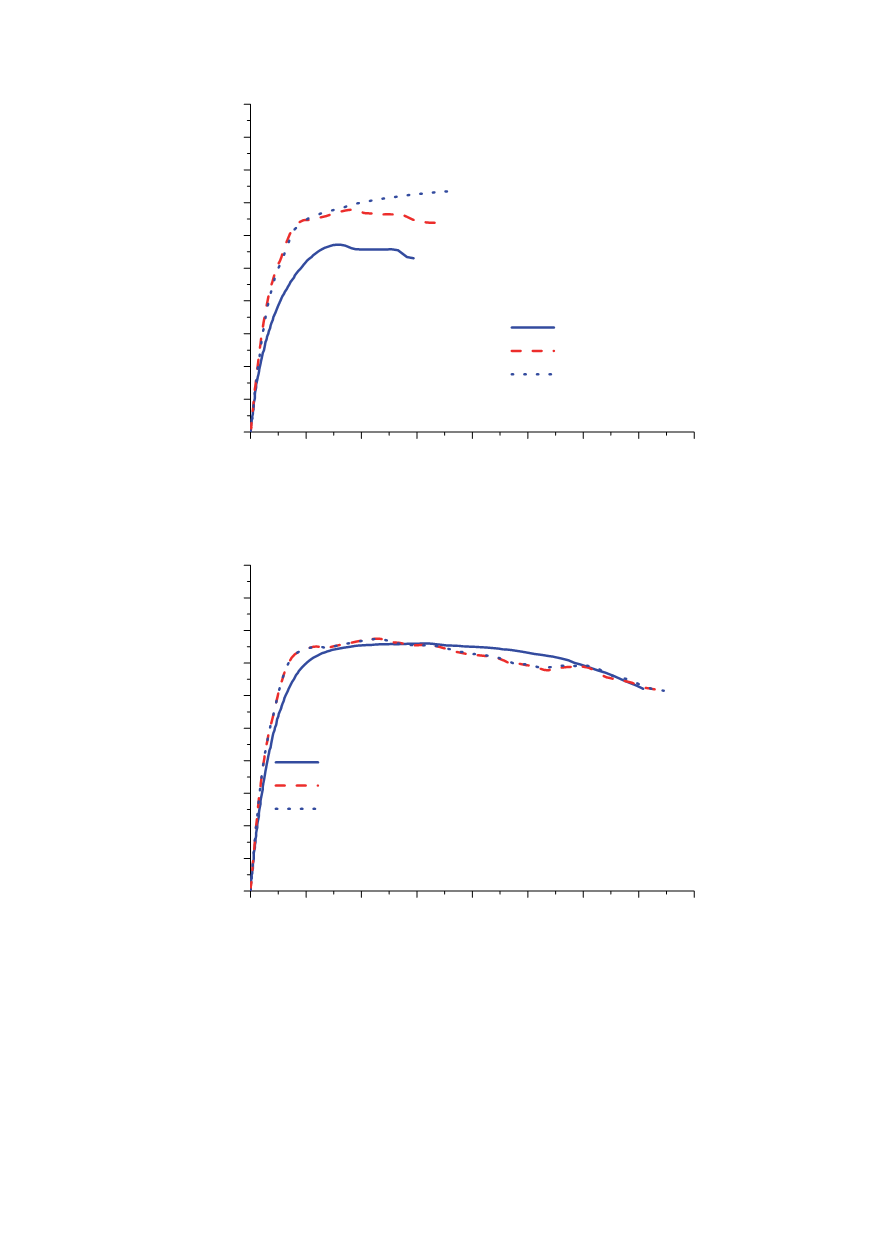
initial crack length
a
0
= 9.4 mm
Experiment
CGM
von Mises
WM 18
F [kN]
CTOD [mm]
Figure 14:
F
-CTOD curves obtained experimentally, using von Mises criterion (without crack
growth) and the CGM (with crack growth) for joint width 18 mm
0.0 0.1 0.2 0.3 0.4 0.5 0.6 0.7 0.8
0
10
20
30
40
50
60
70
80
90
100
initial crack length
a
0
= 8 mm
Experiment
CGM without nucleation of secondary voids
CGM with nucleation of secondary voids
F [kN]
CTOD [mm]
WM 12
Figure 15:
F
-CTOD curves obtained experimentally and using the CGM, with and without
nucleation of secondary voids, for joint width 12 mm
The influence of an important dimension of the specimen, initial crack length
a
0
, is
analysed for two SENB specimens of joint width 6 mm, for
a
0
= 8 mm and
a
0
= 10.4 mm,
corresponding to the experimentally measured lengths.
F
-CTOD curves obtained
experimentally and using the CGM are given in Fig. 16. It is clear that the difference in
behaviour of these two specimens can be assessed using the CGM, and that damage
modelling in the ligament is in good agreement with actual material behaviour.