


 274 / 352

270
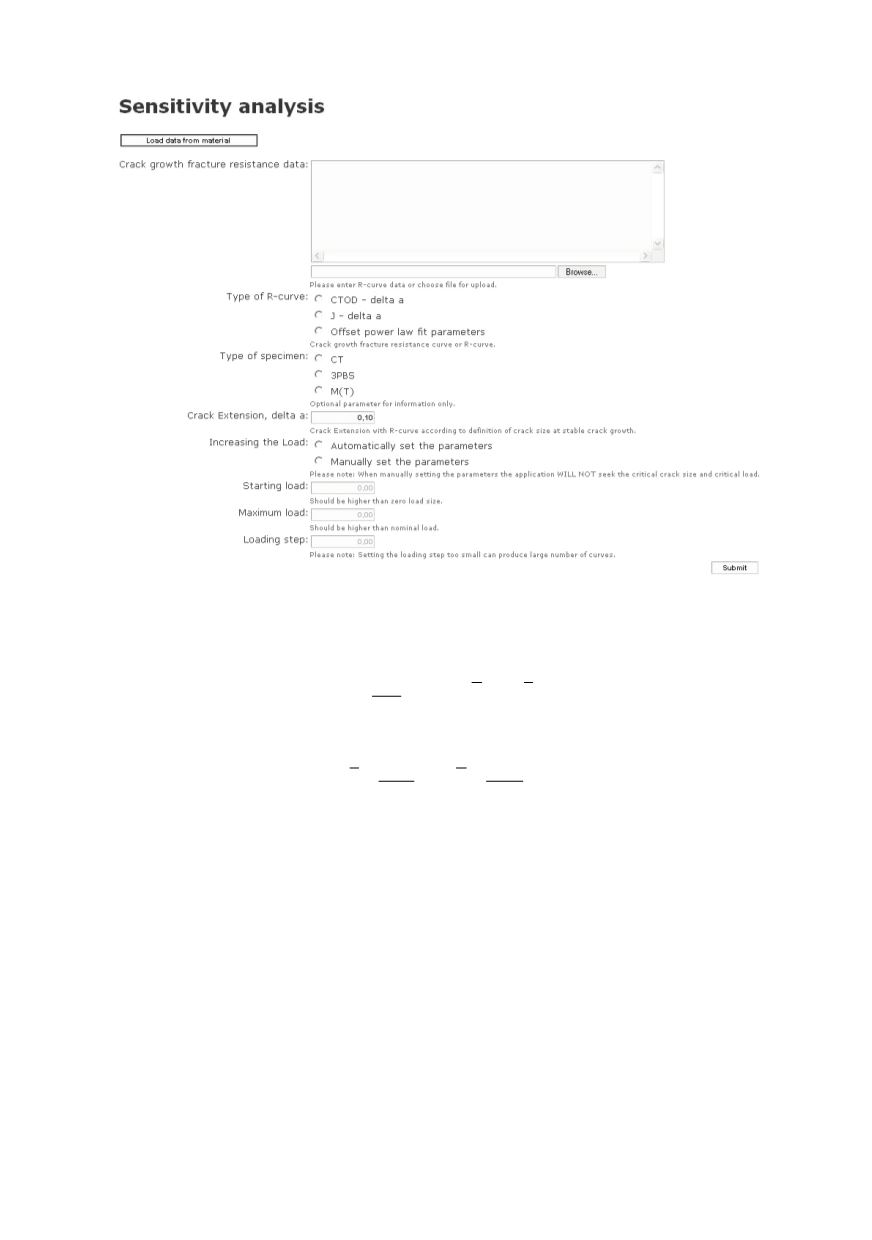
Figure 10: Sensitivity analysis form
The value of D which maximises r should be chosen. The corresponding A and C are
evaluated from
and
xy
xx
S
C
A y C x
S
=
= − ⋅
(4)
where
and
i
i
x
y
x
y
N
N
=
=
∑
∑
The load can be increased manually or automatically. If one chooses the »Manually
set the parameters« option, an appropriate number of curves is drawn, the user has to
choose change manually parameters to achieve the critical curve. In that case, the
»Starting load«, »Maximum load« and »Loading step« are enabled. If one chooses
»Automatically set the parameters«, the program finds automatically the critical curve,
there are also the critical parameters, obtained by Sensitivity analysis, printed.
Thus two additional diagrams are obtained at the end of the procedure (see chapter 3.
Assessment). The load curves are calculated up to the 90% of the physical or validity
condition limitation. FAD diagrams for automatically and manually set parameters are
shown in Figs. 11; 13 and 14.
FAD diagram
There were two boundary conditions evaluated:
1. The curve lies under the FAD diagram break (at
L
r max
)
2. The curve lies above the FAD diagram break (at
L
r max
)