


 275 / 352

271
The latter case usually leads to inadequate results, one should account more on results
obtained from the CDF diagram.
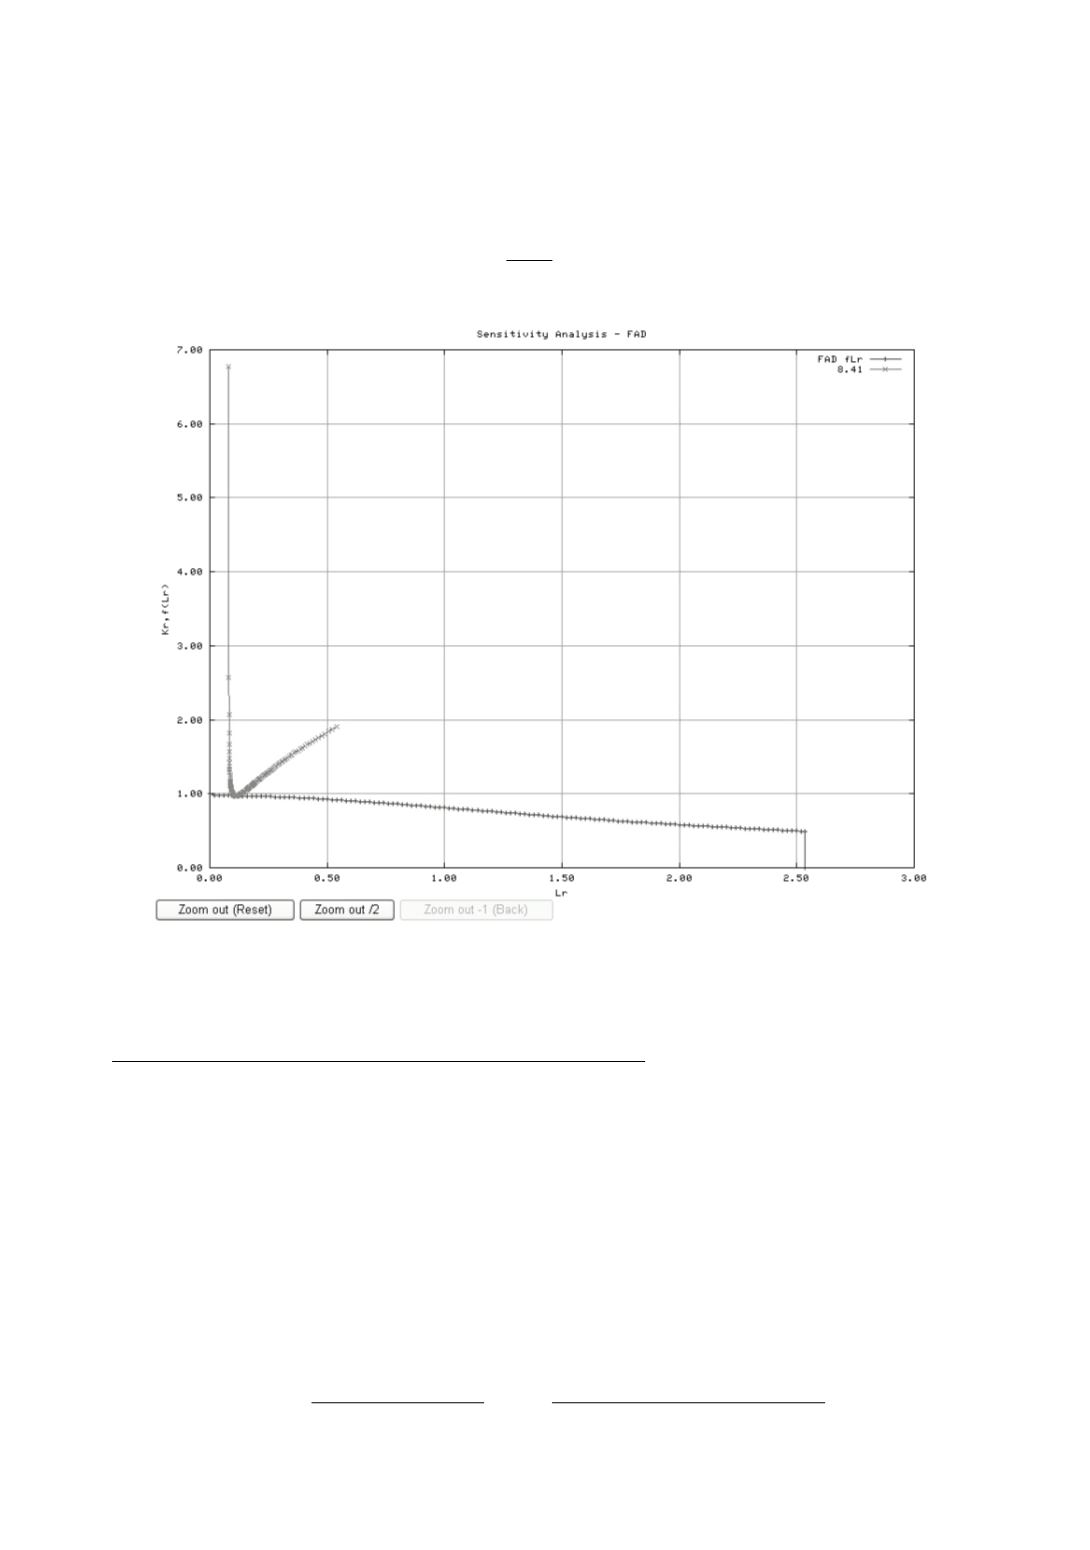
Both boundary conditions are evaluated first by finding a knee point of the load
curves. The knee point is defined as the point, where
1
r
r
K
L
Δ
≈
Δ
(5)
Figure 11: FAD diagram, automatically set parameters
The comparison is made whether the line through the break point of the FAD is above
or under the line through the knee point of the loading curves, as shown in Figure 15.
1. The critical curve lies under the FAD diagram break
In that case the critical curve is suppose to touch the break point of the FAD (
L
r max
,
K
r
), see Fig. 16. Let the line through (0,0) and (
L
r max
,
K
r
) be called a »FAD line«.
Then, two curves are calculated: one with the load below and one with the load above
the point (
L
r max
,
K
r
) that defines the critical load in that case. These curves are defined as
Nominal Load * 0,5 and Nominal load * 1,5.
There's a linear dependency assumed between loads and same (L
r
, K
r
) pairs on
different load curves. The critical L
r
is assumed to be an L
r max
. The critical load can
therefore be calculated from:
critical
i
c r max c
F
F k L n
= = ⋅
+
(6)
where
1
1
1
1
1
1
1
1
1
1
r i , j
i
r i , j
i
i
i
c
c
r i , j
r i , j
r i , j
r i , j
L
F L
F
F F
k
n
L
L
L
L
−
+
+
−
−
+
−
+
−
+
⋅
−
⋅
−
=
=
−
−