


 277 / 352

273
1
1
1
1
1
1
1
1
1
1
j
j
r i, j
j
r i, j
j
cr
c
r i, j
r i, j
r i, j
r i, j
Crack Crack
L
Crack L
Crack
k
n
L
L
L
L
−
+
−
+
+
−
−
+
−
+
−
⋅
−
⋅
=
=
−
−
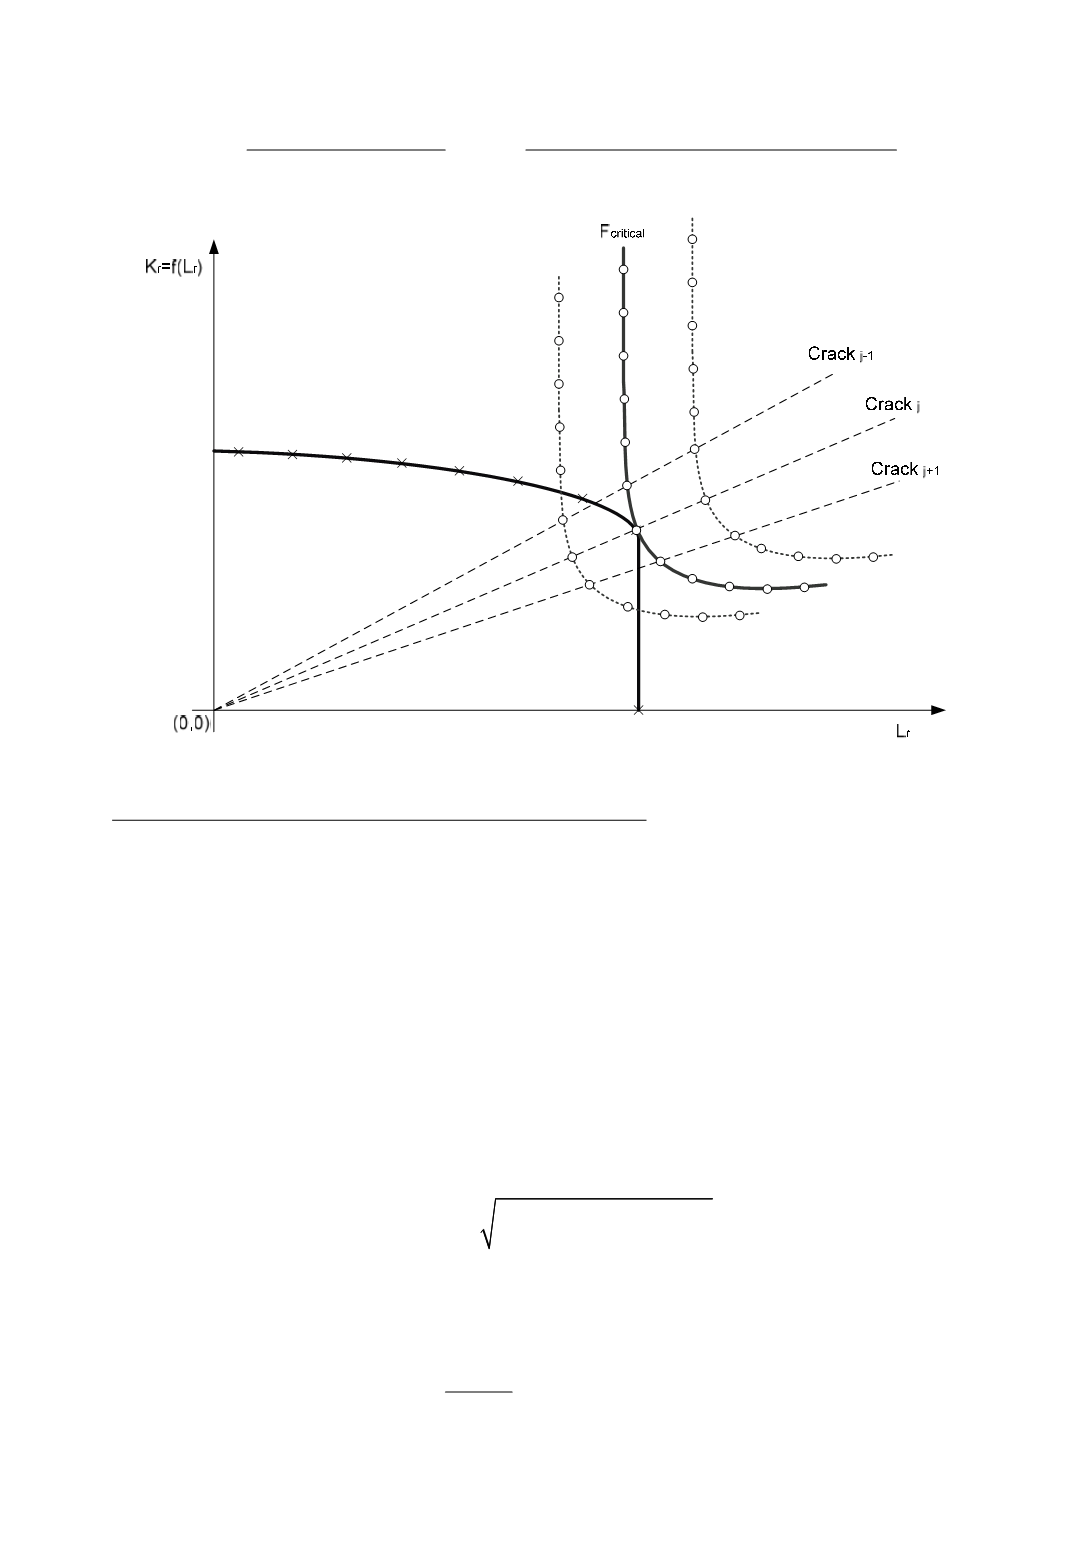
Figure 14: FAD diagrams (critical curve lies below the diagram break)
2. The critical curve lies above the FAD diagram break
First a cross-section between the FAD -
f (L
r
)
and a straight line through the knee of a
load curve is calculated (Fig. 15). Two additional curves are calculated in addition.
Taking a linear dependency between load and a same crack size, the critical load is
calculated as the knee point was the critical point. Then a short check up is performed if
all the points are really under the FAD -
f (L
r
)
curve. If the crack extension goes lower
than the knee, this is usually not the case. This depends on the user, how he or she sets the
crack parameters. Then, the maximum distance between the straight line between two
neighbouring points of FAD -
f (L
r
)
right to the knee of the load curve and the line
through the points of the load curve and (0,0) is calculated:
The load curve is moved in the direction of decreasing the dist to zero, the critical load
can be calculated by taking into account the linear dependency between the load and the
distance of the curve from (0,0). The critical crack value is defined by the point (crack)
that defines the maximum distance
dist
.
(
) (
)
2
2
i
j
i
j
i, j
dist max x x
y y
⎛
⎞
=
− + −
⎜
⎟
⎝
⎠
(8)
There exists a local minimum of the load curve. At that point the load curve will touch
the R-Curve when a proper loading is applied, as shown in Fig. 16. The local minimum is
calculated by differentiation of the load curve.
( 0)
d( J ) min
d( a )
=
=
Δ
(9)