


 278 / 352

274
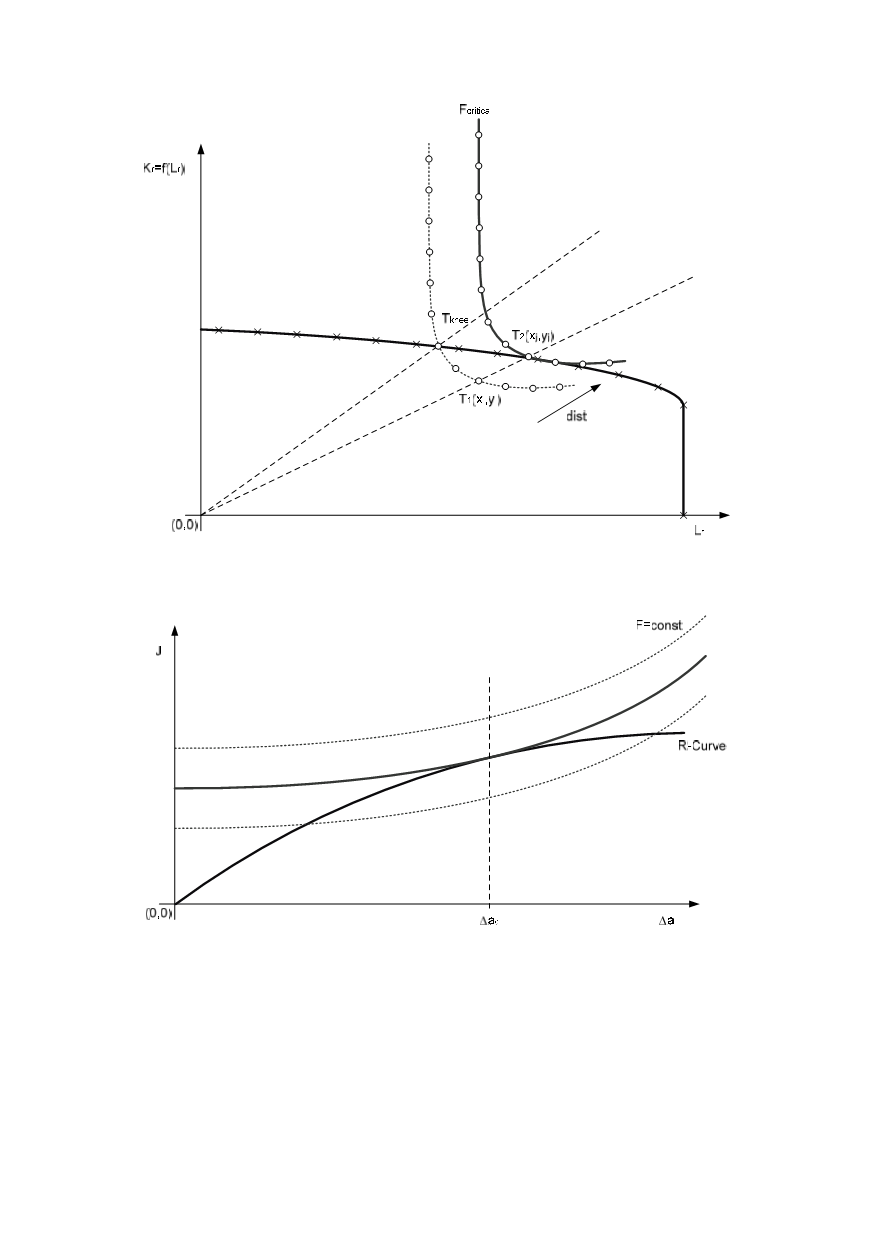
Figure 15: FAD diagrams (critical curve lies above the diagram break)
CDF diagram
Figure 16: CDF diagram
If latter one defines the critical load at Δa
0
, the critical load curve can be calculated.
Usually, the stress intensity factor,
K
I
, is proportional to the loading and geometry
depended, a function of the crack size.
I
K F f ( a )
= ⋅
(10)
where:
F
.......... applied load
F (a)
.......... non-linear function of crack (variable) and dimensions (constant)