


 276 / 352

272
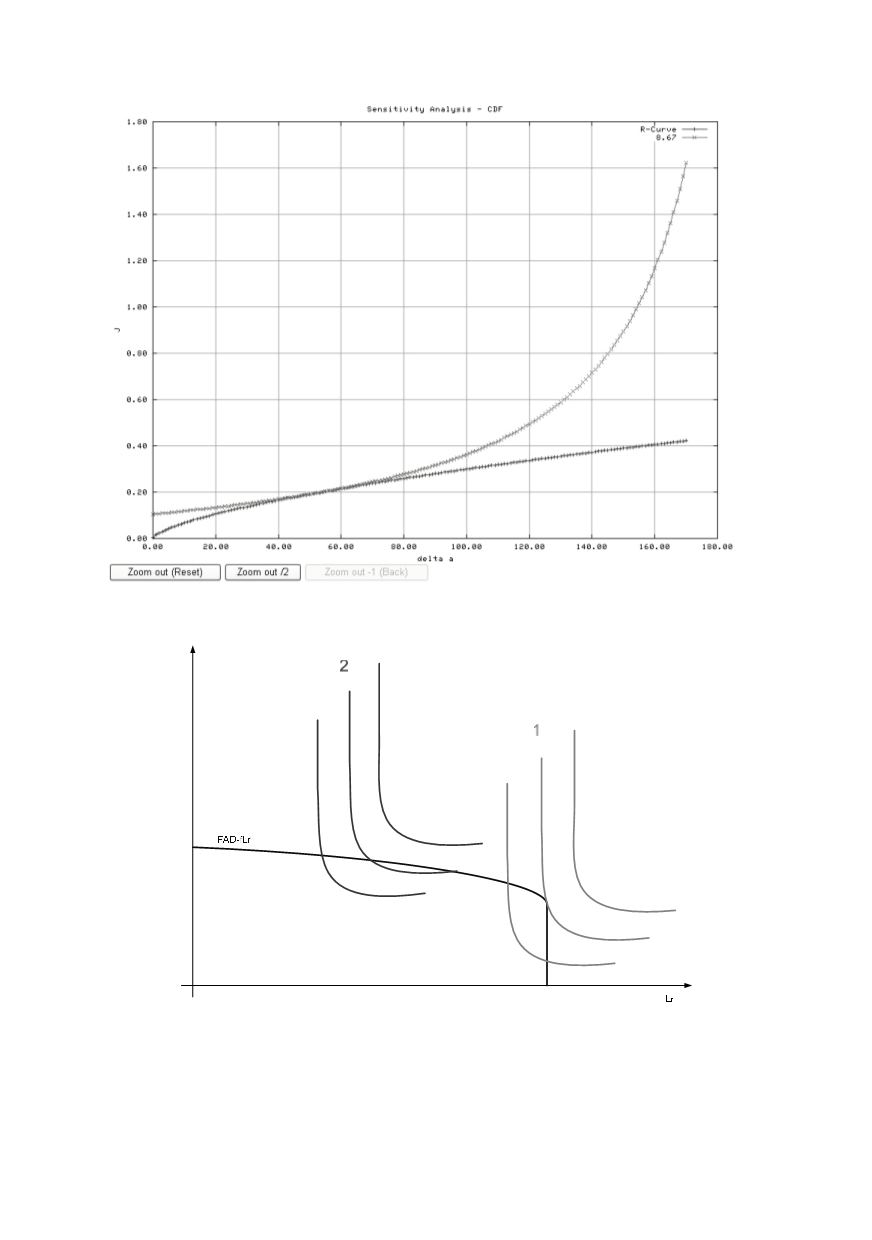
Figure 12: CDF diagram, automatically set parameters
Figure 13: FAD diagrams (critical curves lay above or below the diagram break)
Each point of each loading curve meets a specific crack size. If there is a sufficient
density of points, a linear approximation can serve to obtain an excellent result.
critical
j
cr r max cr
Crack
Crack k L n
=
= ⋅
+
(7)
where