


 273 / 352

269
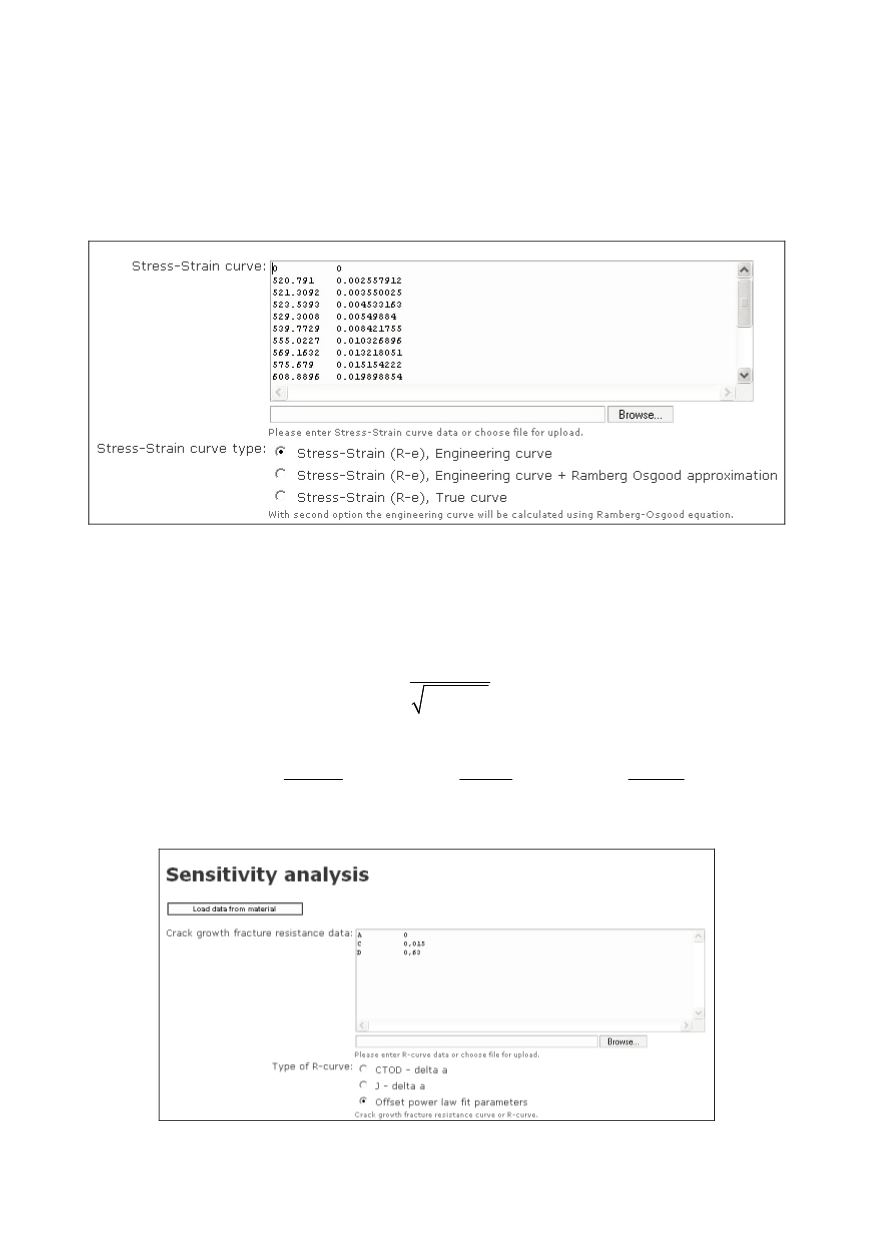
The order of the parameters is not important, but the names must be »A«, »C« and »D«.
See an example in Figs. 9 and 10. One can use either ».« or »,« as a decimal delimiter.
The calculation of the curve from the parameters is performed by the Ref. /7/.
The equation fitted to the crack extension data (
y
i
,
Δa
i
) has a general form
D
y A C a
= + ⋅ Δ
where
y
is either
J
or CTOD,
Δa
is the crack extension, A, C and D are constants.
Figure 8: Stress - strain data form
If ΔaD is substituted with x = ΔaD, A and C can be evaluated using linear regression.
Then, the value D is chosen so as to maximise the correlation coefficient.
One takes the values of D from 0 to 1 in steps of 0.01. For each value of D, the
x
i
=
Δa
D
i
and the correlation coefficient r are calculated:
xy
xx xy
S
r
S S
=
⋅
(2)
where
(
)
(
)
(
)
2
2
2
2
2
2
i
i
i
xx
i
yy
i
zz
i
X
Y
Z
S
X
S
Y
S
Z
N
N
N
= −
= −
= −
∑
∑
∑
∑
∑
∑
(3)
for the
N
data points.
Figure 9: Fracture resistance curve form