


 19 / 352

15
machine CRACKTRONIC in the load-control mode. Test results enabled to relate fatigue
crack growth rate (
da
/
dN
) and stress intensity factor (
Δ
K
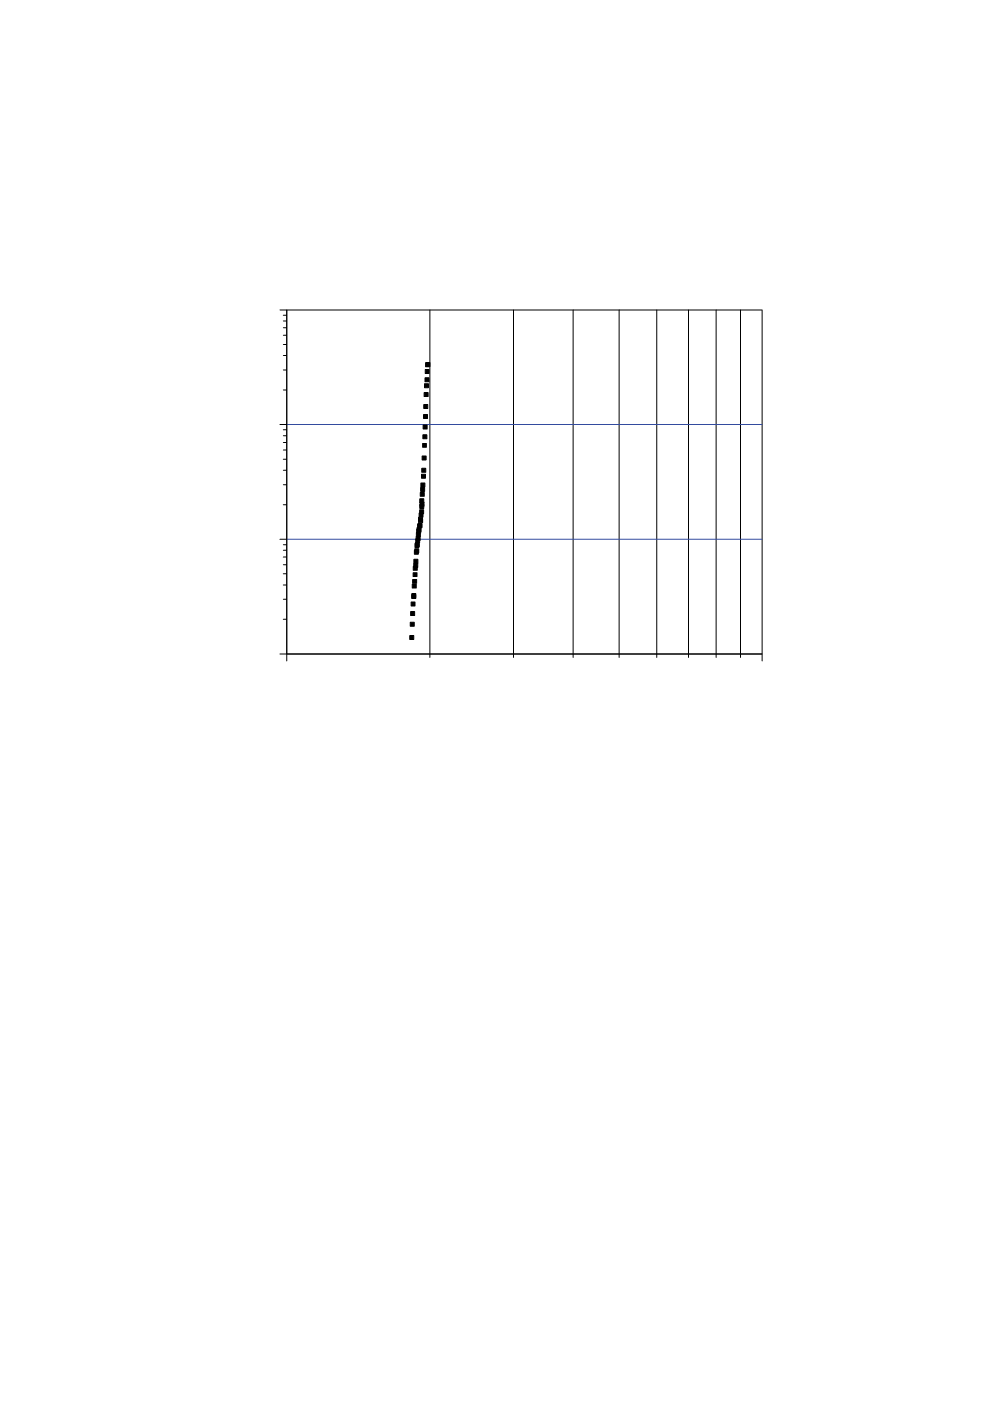
), as plotted in Fig. 11.
One should notice an extremely high crack growth rate, which caused the specimen
fracture after very small increase of the stress intensity factor range
Δ
K
, from the initial,
threshold, value (
Δ
K
th
≈ 18 MPa
√
m), to the final value (
Δ
K
max
≈ 20 MPa
√
m). The number
of cycles spent for crack initiation was
N
i
≈ 200,000, whereas the number of cycles for
crack growth and final fracture was
N
k
≈ 20,000.
10
1
10
2
1
10
100
1000
Brzina rastazamorneprslineda/dN
Opseg faktora intenzitetanapona
Δ
K
Figure 11: Relationship crack growth rate da/dN vs. stress intensity factor range
Δ
K
3.4. Analysis of rupture causes
According to the visual inspection and SEM examination one can conclude that the
final fracture was brittle. The basic macroscopic fracture appearances that indicated such
a conclusion are negligible plastic deformation (existing only near tread surface) and the
existence of ridges which indicate the initial fracture location (fatigue crack). Moreover,
it should be noted that the existence of ridges indicates a quasi-static character of final
fracture. Microscopic fracture characteristics are in accordance with this, since the SEM
examination hasn't indicated the presence of plastic deformation either.
Consequently, the fracture occurred in two steps: first, a fatigue crack appeared, which
further developed in a stabile manner to a critical value; in the second phase, under the
effect of a quasi-static load, the unstable fatigue crack propagation preceded the final
fracture, which was brittle and occurred within a short time interval, i.e. very fast.
The above given number of cycles can not taken as exact because of the different
conditions in service and in fatigue laboratory test. While the fatigue test load is a simple
one and consist of alternate bending and stretching with the same (constant) amplitude, in
service a wheel is subjected additionally to variable thermal stress at each braking.
Mechanical load is relatively simple and causes stresses ranging from a maximal
compressive one (wheel/rail contact) to zero, while thermal shock are more complex and
bring about different stress states in different wheel parts. In the area of the wheel where
fatigue crack appeared, the thermal shock due by braking causes cyclic stresses ranging
from maximal tensile to a compressive stress of lower intensity /4/. Contrary to that, at
Stres intensity factor range
Δ
K
Crack growth rate da/dN