


 138 / 352

134
service. The problem is that the quality of inspection might be poor and the conditions
in service stronger than in production, so the larger defects can pass unnoticed.
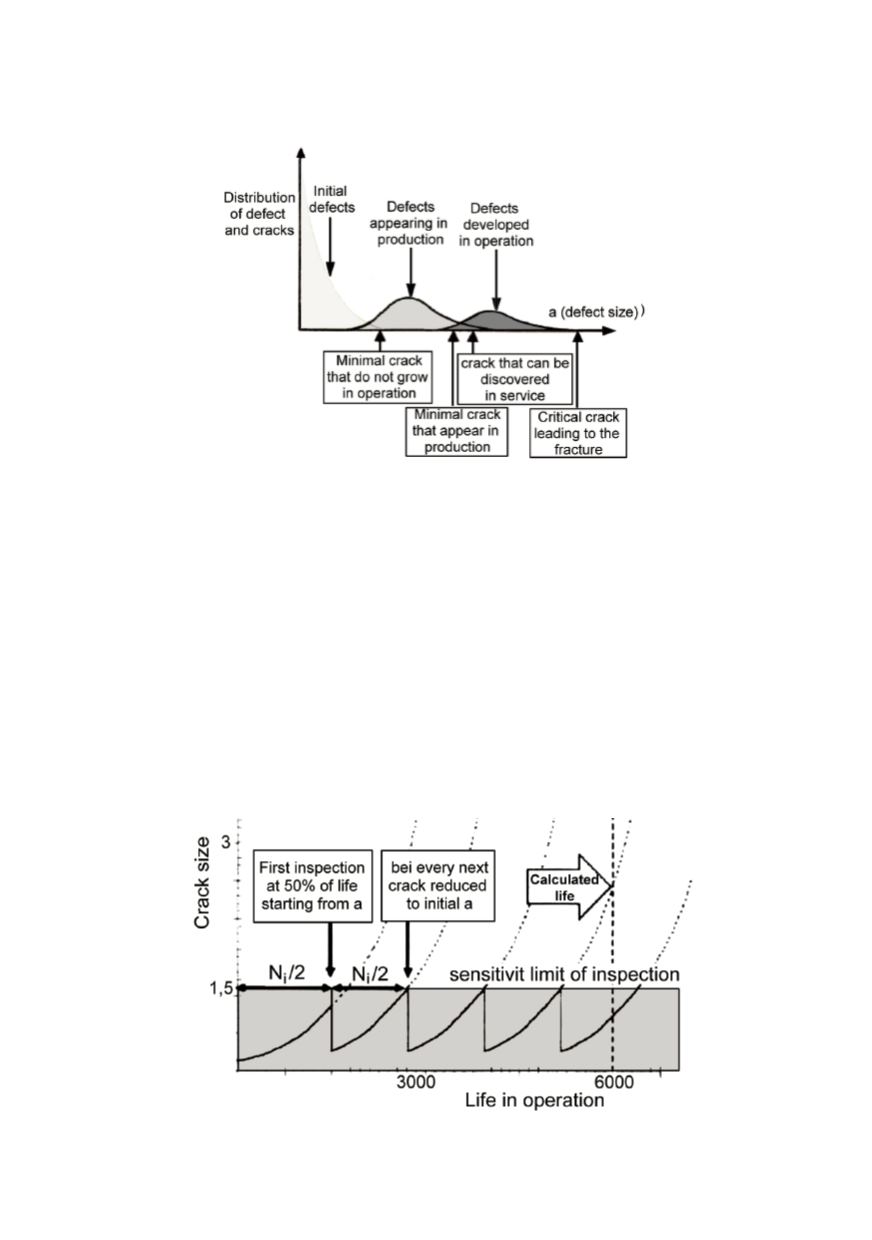
Figure 10: Defect distribution and limit values
Principle FFP-method will be demonstrated on one example whose details are shown
in Fig. 11. Calculated expected design life without cracks is amounted 6000 hours.
Performed analysis showed that crack sized
a
i
= 1.5 mm may stay undetected by applied
inspection sensitivity so that it can grow up to the critical value
a
kr
= 3 during 2800 hours.
For that the first inspection must be carried out by 50% of calculated life based on crack
growth, or after 1400 hours. If by this first inspection the crack still cannot be detected, its
initial size is again assumed to be 1,5 mm and the procedure is repeated. In this way
designed life will be achieved after four inspections. The number of inspections can be
reduced, supposing that the sensitivity of the first inspection is higher. For example, after
production the cracks size of 1 mm can be reliably detected, and in this case can be added
to the life tile first inspection is also half of life corresponding to the crack growth from 1
to 1,5 mm. Even better is if the inspection sensitivity in service can be improved. Direct
saving is measured in this case based on inspection cost reduction, slowdown in
exploitation and the like.
Figure 11: Safe life based on possible crack tolerance