


 118 / 352

114
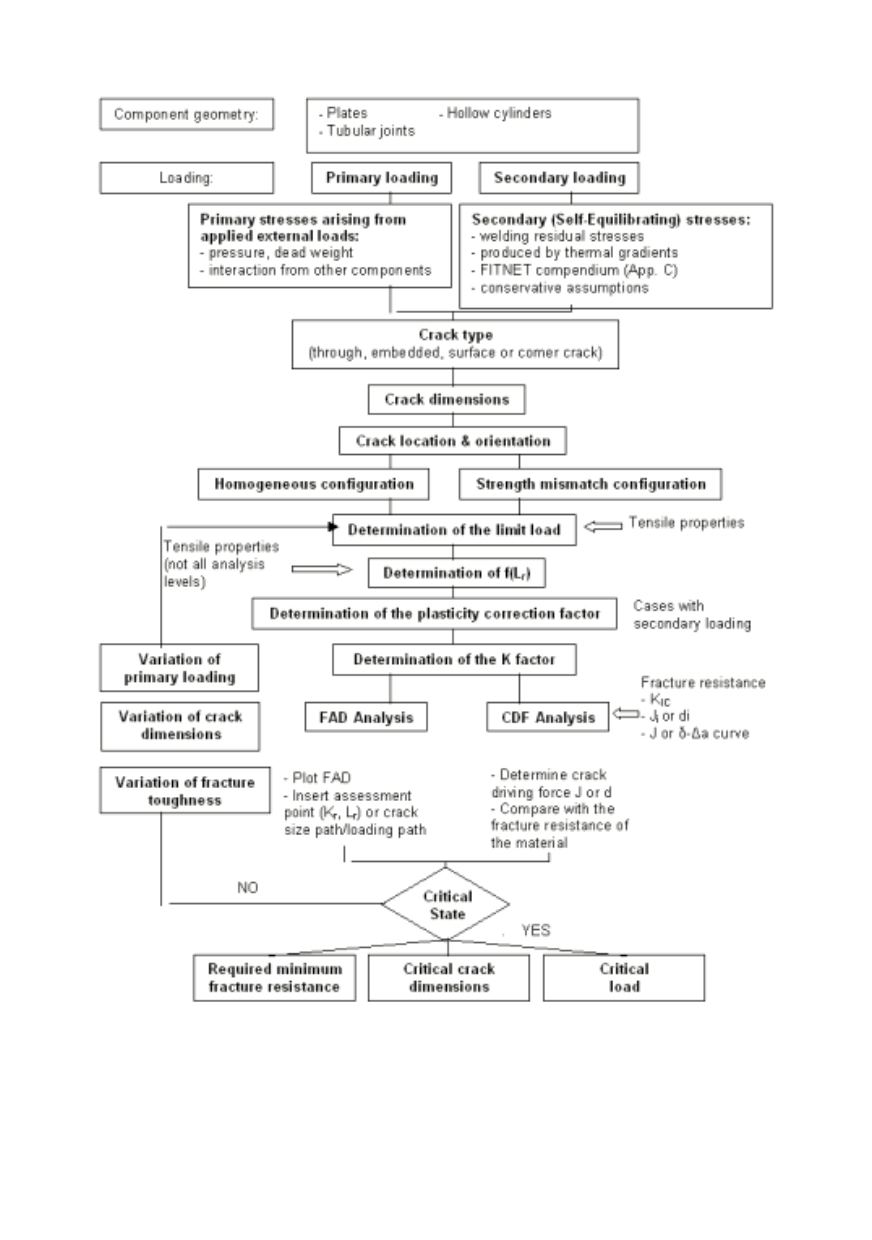
Figure 9: Overall flow chart of the FITNET FFS Facture Module /12/
There are four levels of analysis within the SINTAP defect assessment procedure. An
increase in level corresponds to increased complexity and needs more detailed data, but
for that leads to improved accuracy. Overall structure of the SINTAP procedure has been
depicted in Fig. 10.