


 43 / 352

39
particularly in the ranges where the solution based on stress intensity factor
K
should be
valid.
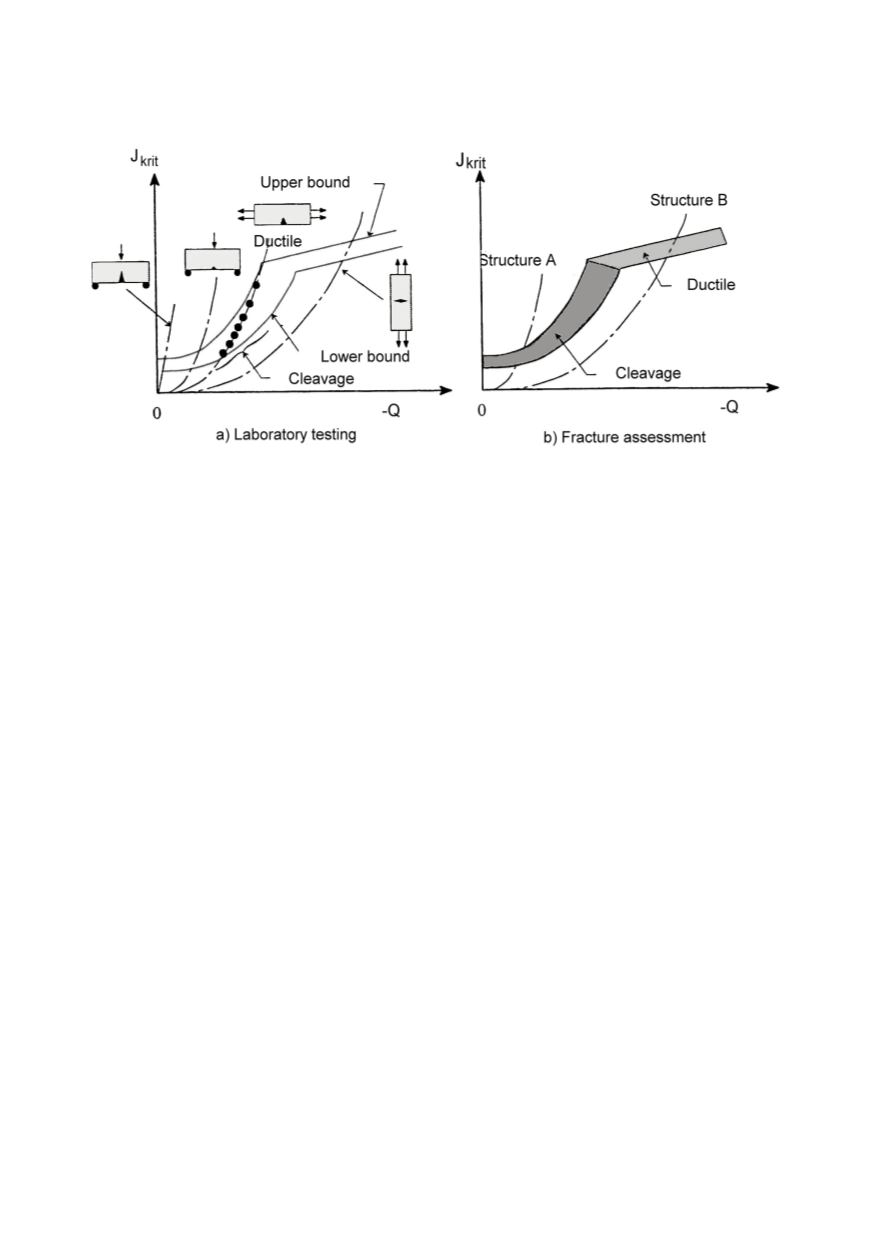
Figure 22: Scheme of J-Q approach (structure A
→
brittle fracture, structure B
→
ductile fracture)
Corresponding EPFM approaches for reliable structural integrity in this case are:
1. Solution based on evaluation of stresses and strains at crack tip (for example based on
HRR solution) and corresponding
J
- integral as criterion.
2. Crack opening displacement as criterion.
3.
Failure Assessments Diagram (FAD), based on fracture mechanics and considers
failure due to plastic collapse.
First two approaches are based on determination of crack driving force (CDF) and the
corresponding procedure can be summed up in following way:
1.
Calculate
J
- integral or Crack Tip Opening Displacement (CTOD)
δ
in dependence
on loading and geometry.
2.
The critical values of
J
- integral (
J
Ic
) and CTOD
(
δ
Ic
) can be determined empirically
by testing standard specimens.
3.
Calculated values of
J
- integral should not be higher than
J
Ic
or CTOD values should
not exceed the critical
δ
Ic
considering required safety margins.
Accordingly, fracture mechanics based on
J
and
δ
application follows the same way as
in the case of LEFM and
K
application. It is expected then that critical conditions at the
crack tip are accurately described by
J
(or
δ
), so that both parameters can be used for the
crack evaluation. Previously discussed limits in this respect should not be overlooked.
5.1. Stress-strain diagrams of material
Important parameter for the calculation that, at the same time, presents the essential
difference to the LEFM procedure is the evaluation and consideration of the elastic-
plastic material behaviour under load. Although the same material and measurement are
applied, this curve is not the same for different methods. Based on use of different
interpretations of the measurements (Fig. 23), the same curve can not be used, since this
will be not in agreement with method requirements. Most often assumption of this curve
is based on true or engineering stress and strain, Ramberg-Osgud curve (Fig. 24):