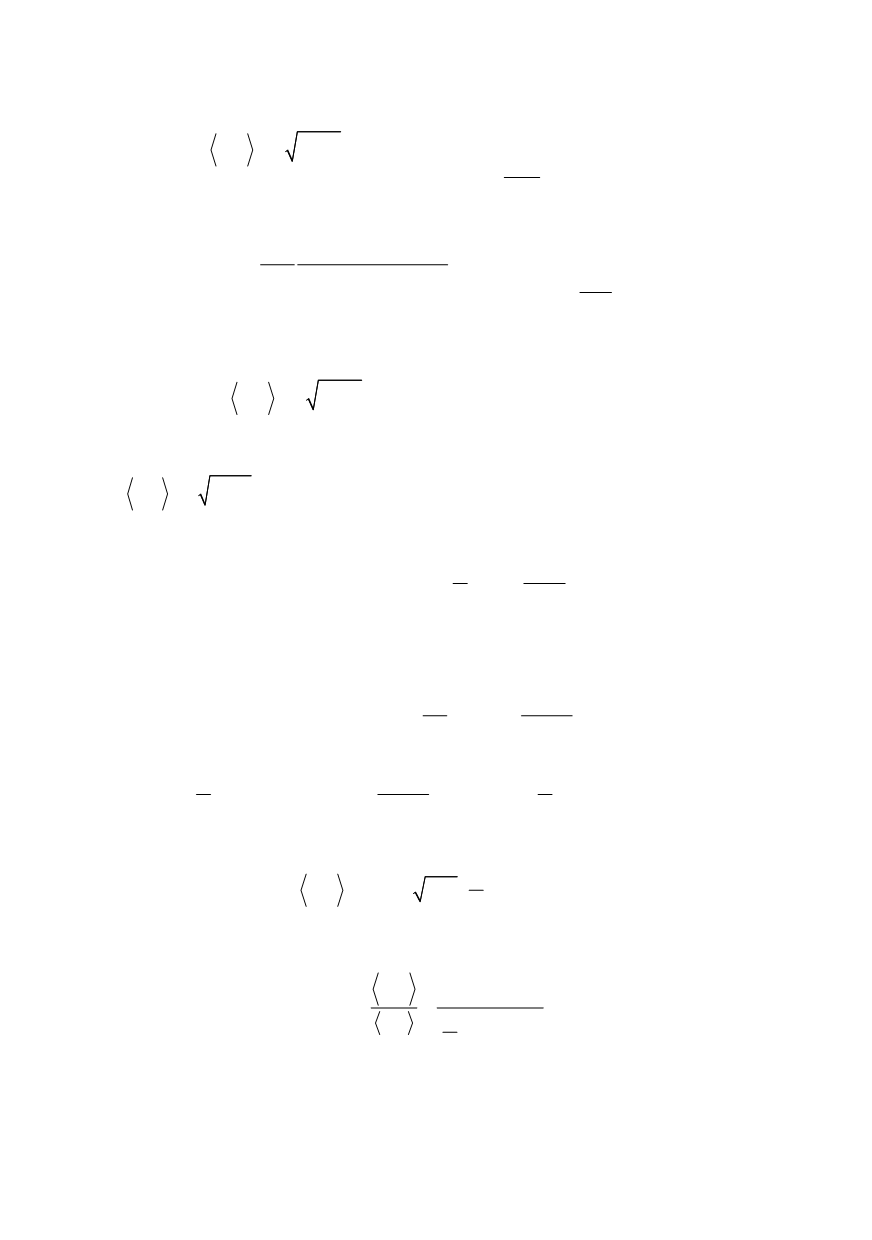

318
1/2 2
1
1
2
2
0
'
'
( '
)
'
( , )
X
f
S
X
X
X R
K S a
X R dX
s ds
α
α
π
α
+
+
⎧
⎫
⎡
⎤
⎪
⎪
⎢
⎥
⎪
⎪
=
+
Φ
⎨
⎬
⎢
⎥
⎪
⎪
⎢
⎥
⎣
⎦
⎪
⎪
⎩
⎭
∫
∫
(33)
With the inner integral denoted by
H
(
X
, R,
α
) and the auxiliary function Φ given as
2
2
1
2
2
1 (1 )
(1 )
( , )
( , , )
( , )
(1 )
X
X R
s
s
s
H X R
s ds
s
α
α
α
α
α
α
α
π
+
+ + −
Φ =
= Φ
−
∫
(34)
both integrals in (33) are evaluated numerically. With the notation (34) final expression
for the desired average is obtained
1/2
1
2
2 2
0
( '
)
( ', , ) '
X
f
S
X
K S a
X R H X R dX
α
α
π
α
+
⎧
⎫
=
+
⎨
⎬
⎩
⎭
∫
(35)
Written in a somewhat shorter form Eq. (35) becomes
1/2
1
2
2 2
0
( , , )
( , , )
( '
)
( ', , ) '
X
f
f
f
S
coh
coh
X
K S a G X R G X R
X R H X R dX
α
α
π
α
α
α
+
⎧
⎫
=
=
+
⎨
⎬
⎩
⎭
∫
(36)
To verify the validity of Eq.(36) note that for
1 / 2
α
→
the function
H
reduces to
[
]
1
1/2
2
( , , )
cos
c
H X R
c R
α
α
π
−
=
⎛
⎞
=
⎜
⎟ +⎝
⎠
(37)
and the function
f
coh
G
becomes identical with the non-fractal result obtained previously
for a discrete cohesive crack, namely
1/2
2
1
1
2
1/2
1/2
2
1
1
1/2
4
'
( '
)
cos
'
'
2
'
2
( '
) cos
'
( , )
'
X
f
coh
X
X
X
X
G
X R
dX
X R
X
X R
dX
I X R
X R
α
π
π
π
+
−
→
+
−
⎧
⎫
⎡
⎤
⎪
⎪
⎛ ⎞
⎛
⎞
⎡
⎤
=
+
=
⎨
⎬
⎜
⎟
⎜ ⎟ ⎢
⎥
⎣
⎦
+ ⎝
⎠
⎝ ⎠ ⎣
⎦
⎪
⎪
⎩
⎭
⎧
⎫
⎡
⎤
⎪
⎪
⎛
⎞
+
=
⎨
⎬
⎜
⎟
⎢
⎥ + ⎝
⎠
⎣
⎦
⎪
⎪
⎩
⎭
∫
∫
(38)
Thus, as expected, the cohesion modulus for
α
- > ½ acquires the form
1/2
0
1/2
2 ( , )
f
S
K
S a I X R
α
π
π
=
⎡
⎤
=
⎢
⎥
⎣
⎦
(39)
The effects of fractality and discrete aspects of fracture on the cohesion modulus let us
examine the ratio
1/2
( , , )
2 ( , )
f
f
S
coh
S
S
K G X R
K
I X R
α
χ
π
=
=
(40)
Figure 5 provides the diagrams illustrating the dependence of this function on the
fractal exponent
α
and the two length-like variables
X
and
R
. Best way to visualize the
effect of these variables is to think of the ratio
R
/
X
. As seen from the graph in Fig. 5 the


