


 321 / 352

317
The plot of the function
χ
σ
vs.
α
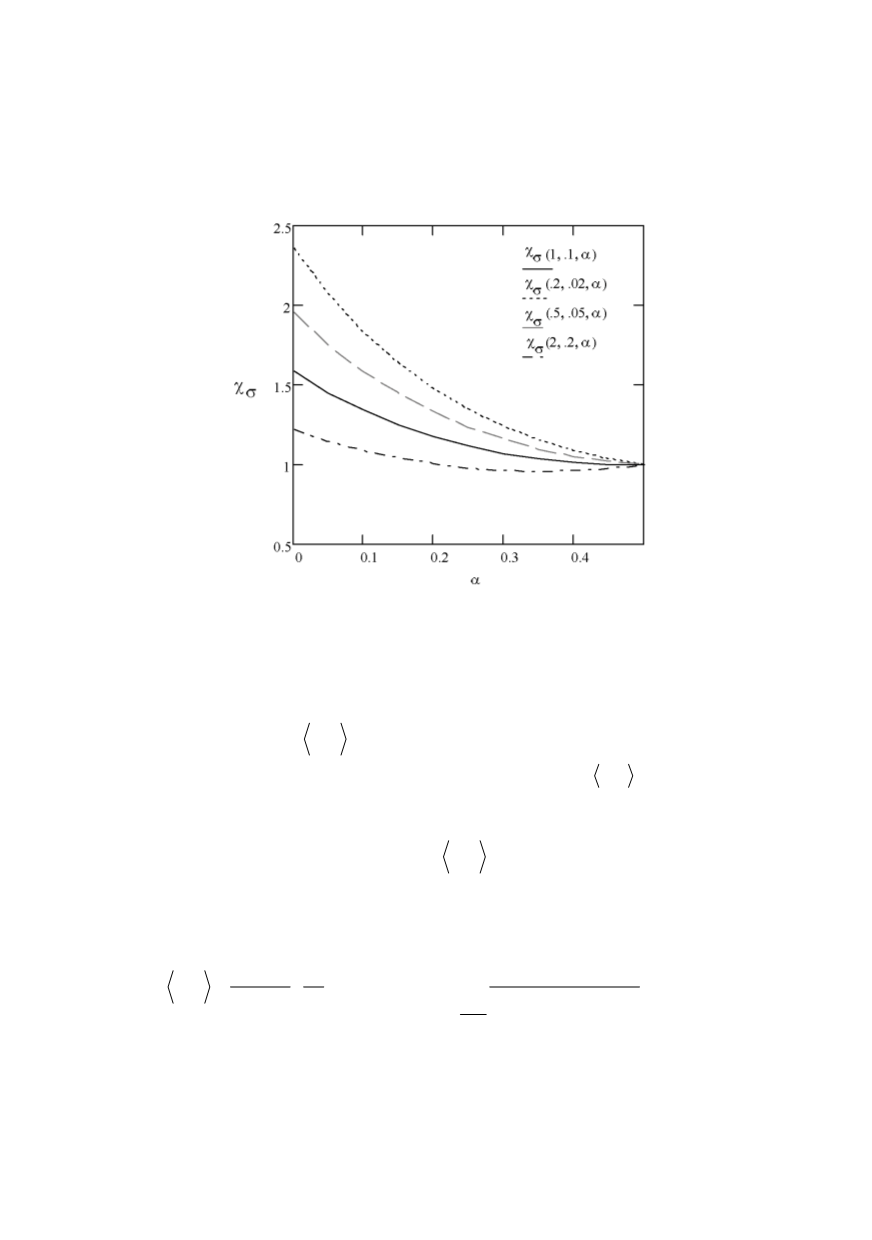
is shown in Fig. 4. Since
χ
σ
depends also on crack
length and the cohesive zone size,
X
and
R
, these two length-like variables are used as
parameters to plot the graphs in Fig. 4. The discrepancies in the
χ
σ
function are particu-
larly visible for the fractal dimension
D
approaching 2 (
α
converging to 0). This effect is
reflected by the larger spread of function values at the vertical axis, where
α
equals zero.
Figure 4: The dependence of function
χ
σ
vs.
α
For the other limiting case of
α
approaching ½, when a fractal crack reduces to a
smooth crack, all curves shown in Fig. 3 converge to unity, which means that the effects
of fractal nature of the crack disappear and the solution for the discrete cohesive model is
recovered. It can also be seen that for the crack sizes comparable to fracture quantum the
magnitude of the average
f
K
σ
is enhanced for any
α
, while for cracks much longer
than
a
0
the value of this average tends to drop below the value
K
σ
valid for a smooth
cohesive crack. Therefore, one may conclude that both discrete nature of fracture and its
fractal geometry alter the solutions obtained for the established cohesive crack models.
To emphasize this, the cohesion modulus
f
S
K
will be evaluated and discussed. This
entity is a function of
X
,
R
and
α
, and its physical meaning is that of material resistance to
initiation and propagation of cracks. Applying the second equation in (23) one obtains
0
1/2 2
2
2
1
2
2 1/2
2
0
1
(1 )
(1 )
(
)
(1 )
c a
f
S
c
c
c R
S
s
s
K
c R dc
ds
a
s
α
α
α
α
α
π
+
−
+
⎧
⎫
⎡
⎤
⎪
⎪
⎢
⎥
+ + −
⎪
⎪
=
+
⎨
⎬
⎢
⎥
−
⎪
⎪
⎢
⎥
⎣
⎦
⎪
⎪
⎩
⎭
∫
∫
(32)
Introducing the nondimensional variables
X
and
R
one obtains