
283
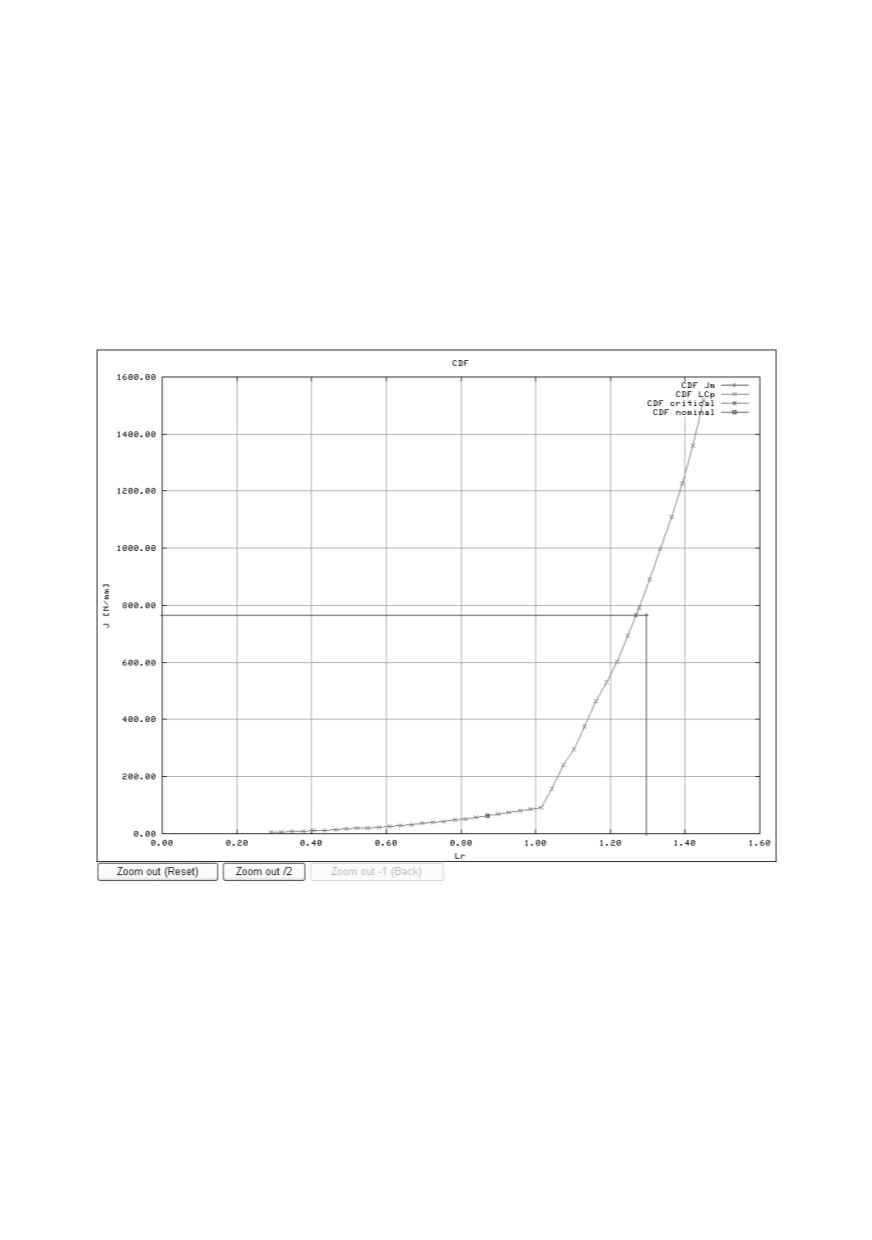
The CDF diagram (Fig. 27) also contains two main curves. The third curve is an
additional vertical straight line originating from the x-axis at the plastic collapse limit.
The first horizontal curve or line describes the fracture resistance J
mat
as the property of
the material in terms of J-integral. The area under the curve is considered as safe, the area
above it is considered as a "potentially unsafe". The second curve is the "Loading curve"
or the "Crack growth curve". It combines the properties of the material and developing
load or growing crack and describes the "Crack driving force". The nominal or operating
point with the initial crack length at designed load lies at this curve. The intersection of
both curves indicates the critical or failure point. With developing load or growing crack
the operating point slips from the "safe" towards the "potentially unsafe" region.
Figure 27: CDF diagram created from user input data
4 Conclusion
The application of the software of the Fracture module of the Procedure to real case
gives simple single but important information about materials properties requirements.
The software is possible to use in design stage (choice of right material) and using state.
Software is established with module structure which incorporates each component as
modul with known limit load solutions and stress intensity factor solution. In the software
is SINTAP concept /2/ applied for structure integrity analysis. Software check valid
conditions for solutions and provide possiblity to change stress intensity factor with new
solution or add new component. Material modul includes rutine for input mechanical


