


 286 / 352

282
After the last dialog is confirmed, the SINTAP-FRACTURE MODE calculation is
performed in two steps. The first stage is performed in Python environment. Firstly, the
selected parameter is increased, and then the calculation of stress intensity factor, limit
load, reference stress and normalised load is performed. The data is transferred into the
main application before the second stage follows. The second stage is the standard
SINTAP-FRACTURE MODE procedure with prescribed equations. Their selection
depends on the level of the procedure and on the type of material yielding (Lüders
plateau).
There are three “zoom controls”:
−
Zoom out (Reset)
resets all zooms
−
Zoom out /2
zooms the area marked with the mouse
−
Zoom out -1 (Back)
returns picture to the previous zoom
Each diagram contains two curves.
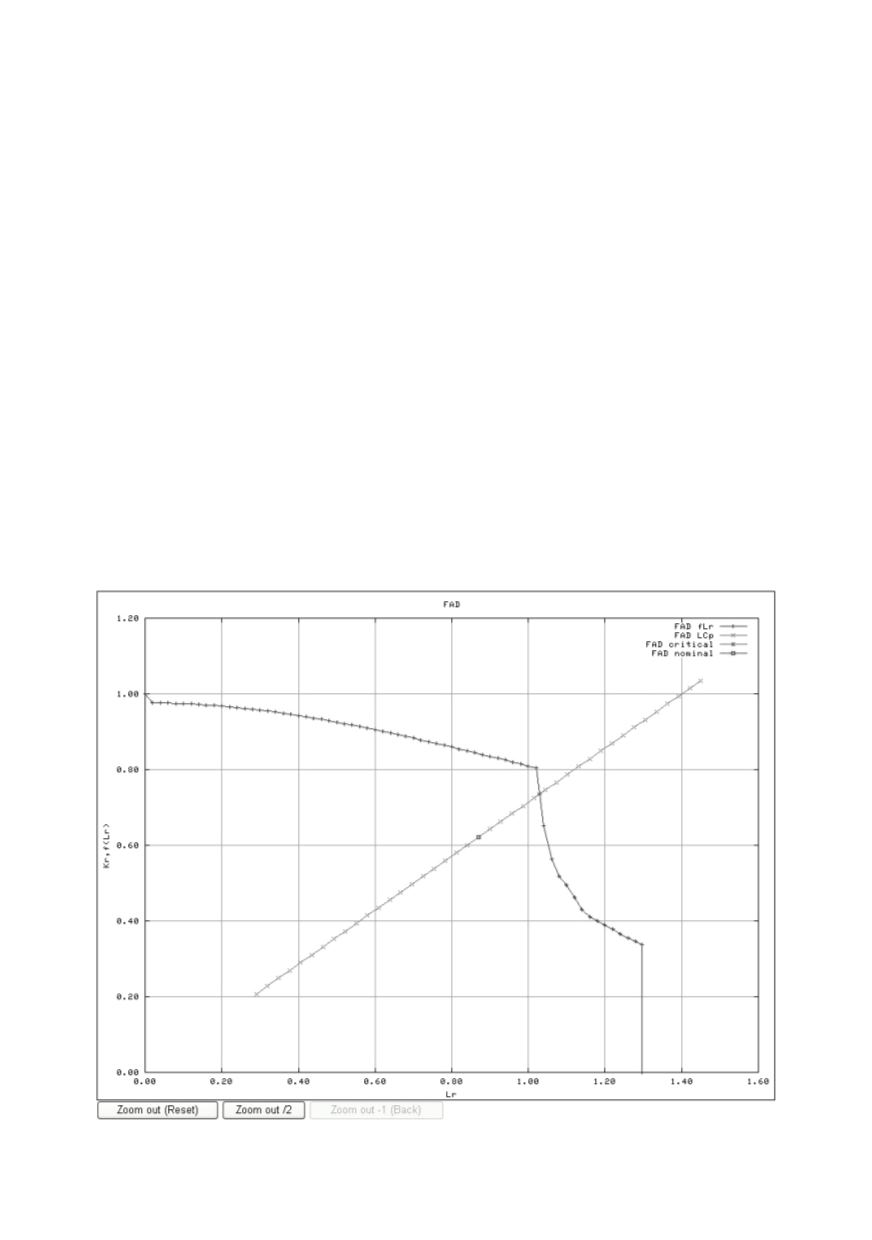
The FAD diagram contains a curve, that originates from point (0, 1) and ends at the
plastic collapse limit, as shown in Fig. 26. The curve is named a "Failure assessment
curve" (also "Failure curve") and describes behaviour of the material. The area under the
curve is considered as failure safe; the area above it is considered as "potentially unsafe".
The second curve is called "Loading curve" (the load is increasing along this curve); it
can also be named as "Crack growth curve" (the crack is growing along this curve). The
nominal or operating point with an initial crack length at designed load lies at this curve.
The intersection of both curves indicates the critical or failure point.
Figure 26: FAD diagram created from user input data