


 330 / 352

326
needed to create new crack surfaces. The calculation applied by Griffith is complicated,
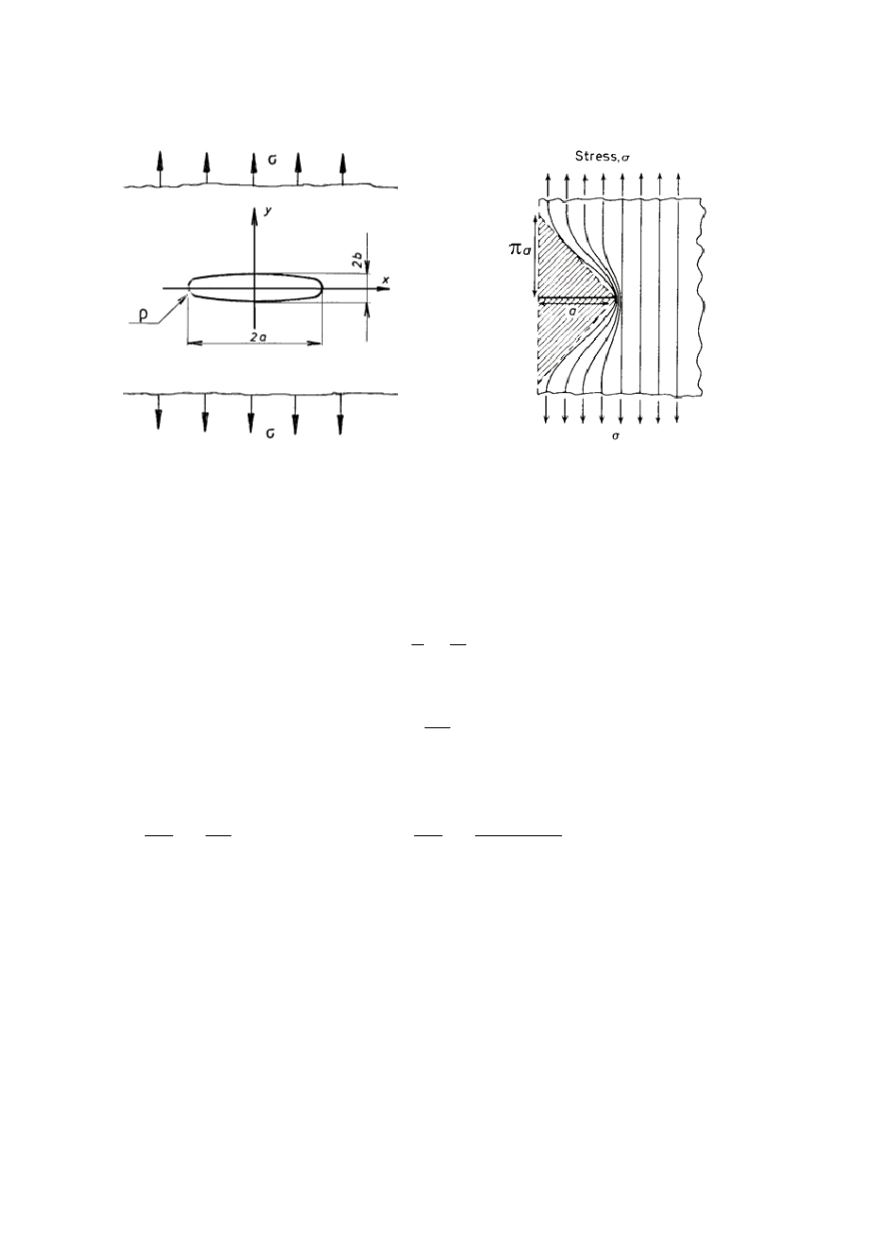
but the same result is obtained by simplification using concept of stress-lines, Fig. 5
/10/.
Figure 4. Griffith’s crack: geometrical
configuration
Figure 5. Simplified model for approximate
calculation of strain energy release rate /10/
Two half-crack lengths
a
and
(a +
δ
a)
are considered under fixed-grip conditions,
exposed to applied stress
σ
. The stress-free regions above and below the crack can be
roughly triangular in shape and extended to a height
π
. Then, for a length
a
, the strain
energy release
U
per unit thickness (
B
= 1) is given in plane stress by
½
×
stress (
σ
)
×
strain (
σ
/
E
)
×
area (
π
a
2
), i.e.
2
1
2
U
a
E
σ
σ
π
= − ⋅ ⋅
(1)
thus, for a length increase
da
, the decrease of the strain energy is
2
dU
a da
E
σ
π
= − ⋅
(2)
In plane strain, the tensile strain is given as
σ
(1 – v
2
)/E
(
v
is Poisson’s ratio) instead
σ
/E
, and the change in energy with crack length,
∂
U/
∂
a
, is:
2
U
a
a E
σ π
∂
= −
∂
(for plane stress)
2
2
1
U (
) a
a
E
σ
ν
π
∂
−
= −
∂
(for plane strain) (3)
In order to verify the results of Griffith, crack is modelled in an ideal crystalline body
by increased atom distance at the tip under applied remote stress
σ
(Fig. 6), considering
the change in crack-driving force
F
with the crack extension at atomic level /10/.
The strength is taken as a tensile stress
σ
, which must be applied to cause the fracture
across a particular crystallographic plane of cubic lattice with initial atomic spacing
b
o
.
Stress
σ
is simply the sum of the forces,
F
, acting between successive pairs of atoms. To
a first approximation, the value of
F
required to cause fracture corresponds to that
needed to separate an isolated pair of atoms such as AB. For a pair of atoms, such as AB,
CD,...PQ it is possible to draw a curve to represent their energy of interaction as a
function of distance of separation
b
(Fig. 7). The resultant energy,
U
, exhibits a mini-
mum at the equilibrium lattice spacing
b
o
. Some energy must be spent to increase the